The Uncertainty Paradox

Doubt is not a pleasant condition, but certainty is an absurd one. —Voltaire

“The market hates uncertainty” has been a common enough saying in recent years, but how logical is it? There are many different aspects to uncertainty, some that can be measured and some that cannot. Uncertainty is an unchangeable condition of existence. As individuals, we can feel more or less uncertain, but that is a distinctly human phenomenon. Rather than ebbing and flowing with investor sentiment, uncertainty is an inherent and ever-present part of investing in markets. Any investment that has an expected return above the prevailing “risk-free rate” (think T-Bills for US investors) involves trading off certainty for a potentially increased return.

Consider this concept through the lens of stock vs. bond investments. Stocks have higher expected returns than bonds largely because there is more uncertainty about the future state of the world for equity investors than bond investors. Bonds, for the most part, have fixed coupon payments and a maturity date at which principal is expected to be repaid. Stocks have neither. Bonds also sit higher in a company’s capital structure. In the event a firm goes bust, bondholders get paid before stockholders. So, do investors avoid stocks in favor of bonds because of this increased uncertainty? Quite the contrary, many investors end up allocating capital to stocks due to their higher expected return. In the end, many investors are often willing to make the trade off of bearing some increased uncertainty for potentially higher returns.

Managing Emotions: While the statement “the market hates uncertainty” may not be totally logical, it doesn’t mean it lacks educational value. Thinking about what the statement is expressing allows us to gain insight into the mindset of individuals. The statement attempts to personify the market by ascribing the very real nervousness and fear felt by some investors when volatility increases. It is recognition of the fact that when markets go up and down, many investors struggle to separate their emotions from their investments. It ultimately tells us that for many an investor, regardless of whether markets are reaching new highs or declining, changes in market prices can be a source of anxiety. During these periods, it may not feel like a good time to invest. Only with the benefit of hindsight do we feel as if we know whether any time period was a good one to be invested. Unfortunately, while the past may be prologue, the future will forever remain uncertain.

Staying in Your Seat: In a recent interview, David Booth, the founder of Dimensional Fund Advisors, was asked about what it means to be a long-term investor:

“People often ask the question, ‘How long do I have to wait for an investment strategy to pay off? How long do I have to wait so I’m confident that stocks will have a higher return than money market funds, or have a positive return?’ And my answer is it’s at least one year longer than you’re willing to give. There is no magic number. Risk is always there.”

Part of being able to stay unemotional during periods when it feels like uncertainty has increased is having an appropriate asset allocation that is in line with an investor’s willingness and ability to bear risk. It also helps to remember that, during what feels like good times and bad, one wouldn’t expect to earn a higher return without taking on some form of risk. While a decline in markets may not feel good, having a portfolio you are comfortable with, understanding that uncertainty is part of investing, and sticking to a plan that is agreed upon in advance and reviewed on a regular basis can help keep investors from reacting emotionally. This may ultimately lead to a better investment experience.

Investment Shock Absorbers

Ever ridden in a car with worn-out shock absorbers? Every bump is jarring, every corner stomach-churning, and every red light an excuse to assume the brace position. Owning an undiversified portfolio can trigger similar reactions.[1]

Throw in the risk of a breakdown or running off the road altogether, and there’s a real chance you may not reach your destination. In the world of investment, a similarly bumpy and unpredictable ride can await those with concentrated and undiversified portfolios or those who constantly tinker with their allocation.

Of course, everyone feels in control when the surface is straight and smooth, but it’s harder to stay on the road during sudden turns and ups and downs in the market.

For that reason, the smart thing to do is to diversify, spreading your portfolio across different securities, sectors, and countries. That also means identifying the right mix of investments (e.g., stocks, bonds, real estate) that aligns with your risk tolerance.

Using this approach, your returns from year to year may not match the top performing portfolio, but neither are they likely to match the worst. More importantly, this is a ride you are likelier to stick with.

Here’s an example. Among developed markets, Denmark was number one in US dollar terms in 2015 with a return of more than 23%. But a big bet on that country the following year would have backfired, as Denmark slid to bottom of the table with a loss of nearly 16%.[2]

It’s true that the US stock market (by far the world’s biggest) has been a strong performer in recent years. But a decade before, in 2004 and 2006, it was the second worst-performing developed market in the world.

Predicting which part of a market will do best over a given period is tough. US small cap stocks were among the top performers in 2016 with a return of more than 21%. A year before, their results looked relatively disappointing with a loss of more than 4%. International small cap stocks had their turn in the sun in 2015, topping the performance tables with a return of just below 6%. But the year before that, they were the second worst with a loss of 5%. [3]

Investment Shock Absorbers (Continued)

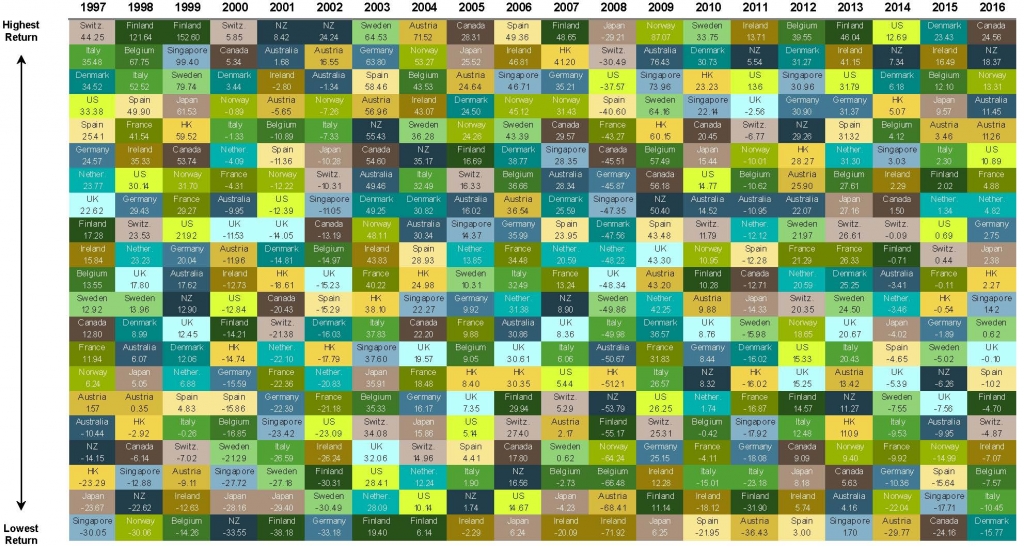
If you’ve ever taken a long road trip, you’ll know that conditions along the way can change quickly and unpredictably, which is why you need a vehicle that’s ready for the worst roads as well as the best. While diversification can never completely eliminate the impact of bumps along your particular investment road, it does help reduce the potential outsized impact that any individual investment can have on your journey.

[1] Adapted from “Investment Shock Absorbers,” Outside the Flags, February 2017.

[2] In US dollars. MSCI developed markets country indices (net dividends).

[3] In US dollars. US Small Cap is the Russell 2000 Index. International Small Cap is the MSCI World ex USA Small Cap Index (gross dividends).

High Valuations Conundrum

Much research has been done on stock valuations, and historically buying into the market at lower valuations has seen higher returns than when buying in at higher valuations. However, the data is noisy. 

On the following chart, the green area represents the 10-year trailing price-to-earnings (P/E) ratio of the S&P 500, commonly referred to as the CAPE ratio. You can think of this as a gauge to see if the overall price of the stock market is expensive or cheap. As you can see, we’re currently at a fairly-elevated level, around 29 dollars of price for every dollar of earnings, though far below the peaks seen in 2000. [4]

It can be enticing to think it’s possible to time the market based on valuation ratios like these, but even the creator of this ratio, Professor Robert Shiller, cautions against using the ratio to make trades. And keep in mind you have to guess right not once, but twice — knowing when to get back into the market.

Take, for example, the last time the 10-year trailing P/E ratio of the S&P 500 broke through the current level was in February 1997. If you had sold out fearing high valuations at that time, you would have missed out on another three years of up markets, cumulating an additional 86% gain before seeing any meaningful decline.

At that point in February 1997, the S&P 500 was trading at 798; if you sold out waiting to buy back in once the market was lower, you would have had to wait twelve years, until March 2009. And if you missed that brief opportunity, you might still be waiting some 20 years later. Meanwhile, the S&P 500 is above 2,300.

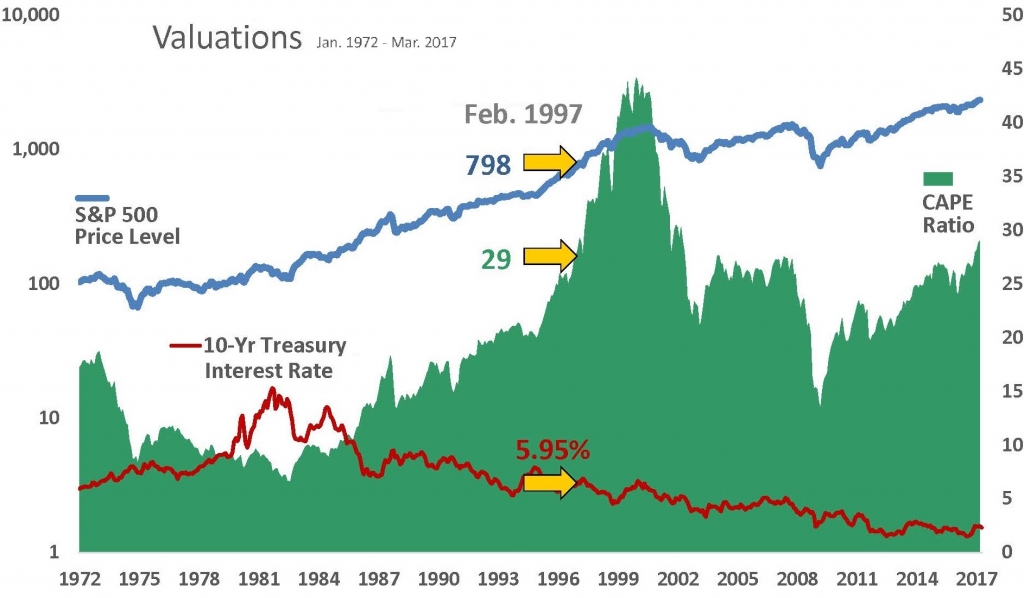
Furthermore, it is important to note the level of interest rates over the last 20 years, as they are a major force on stock prices. A stock is generally valued by how much cash can be obtained from the company between now and judgment day, discounted by a benchmark rate. Many stock investors use the yield on the 10-year US Treasury bond as their benchmark rate, because it is assumed to be risk free and generally matches their investment time horizon.

In February 1997, the yield on the 10-year Treasury was 5.95%, and it has steadily declined since then, now standing at 2.38%, as of March 31, 2017. This might seem like a small change of only 3.57% (5.95% - 2.38% = 3.57%), but in percentage terms, it is a large 60% decrease (3.57% / 5.95% = 60%).

In the stock price equation, when the discount rate goes down, stock prices go up, and, at these levels, small changes in the discount rate can have a significant effect on an investor’s final valuation of a stock—this is just mathematics.

The difficulty arises in trying to predict the future scenario for interest rates. If an investor assumes these low levels of interest rates will continue for a long time, then stock prices look cheap, and they should buy, buy, buy. However, if an investor assumes interest rates will rise, then stocks start to look fully valued to expensive.

And both interest rate scenarios are a reality—for the low interest rate outcome just look to Japan over the last 30 years or the US in the 1940s, and for the high interest rate outcome look to the US in the 1980s.

Therefore, at TAGStone Capital, we recommend a balanced approach between stocks and bonds, with an appropriate rebalancing strategy, in case either scenario plays out. Instead of trying to predict what interest rates will be in three to ten years, we think a better strategy is to target dimensions of higher returns (size, value, and profitability) and stay the course when the market gets bumpy.

[4] Source: Robert Shiller Online Data library via Yale. CAPE tracks current S&P 500 price versus average of inflation-adjusted earnings over previous 10 years.


Past performance does not guarantee future results. All investments include risk and have the potential for loss as well as gain.

Data sources for returns and standard statistical data are provided by the sources referenced and are based on data obtained from recognized statistical services or other sources we believe to be reliable. However, some or all information has not been verified prior to the analysis, and we do not make any representations as to its accuracy or completeness. Any analysis nonfactual in nature constitutes only current opinions, which are subject to change. Benchmarks or indices are included for information  purposes  only  to  reflect  the  current  market  environment;  no  index  is  a directly  tradable  investment.  There  may  be  instances  when  consultant  opinions  regarding any fundamental or quantitative analysis do not agree.

The  commentary  contained  herein  has  been  compiled  by  W.  Reid  Culp,  III  from  sources  provided  by  TAGStone  Capital,  Capital  Directions,  DFA,  Vanguard,  Morningstar,  as  well  as  commentary  provided  by  Mr.  Culp,  personally,  and  information  independently  obtained  by  Mr.  Culp.  The  pronoun  “we,”  as  used  herein,  references collectively the sources noted above.

TAGStone Capital, Inc. provides this update to convey general information about market conditions and not for the purpose of providing investment advice. Investment in any of the companies or sectors mentioned herein may not be appropriate for you. You should consult your advisor from TAGStone for investment advice regarding your own situation.