The Uncommon Average:
“I have found that the importance of having an investment philosophy—one that is robust and that you can stick with— cannot be overstated.”
—David Booth
The U.S. stock market has delivered an average annual return of around 10% since 1926.1 But short-term results generally vary, and in any given period stock returns can be positive, negative, or flat. When setting expectations, it’s helpful to see the range of outcomes experienced by investors historically. For example, how often have the stock market’s annual returns actually aligned with its long-term average?
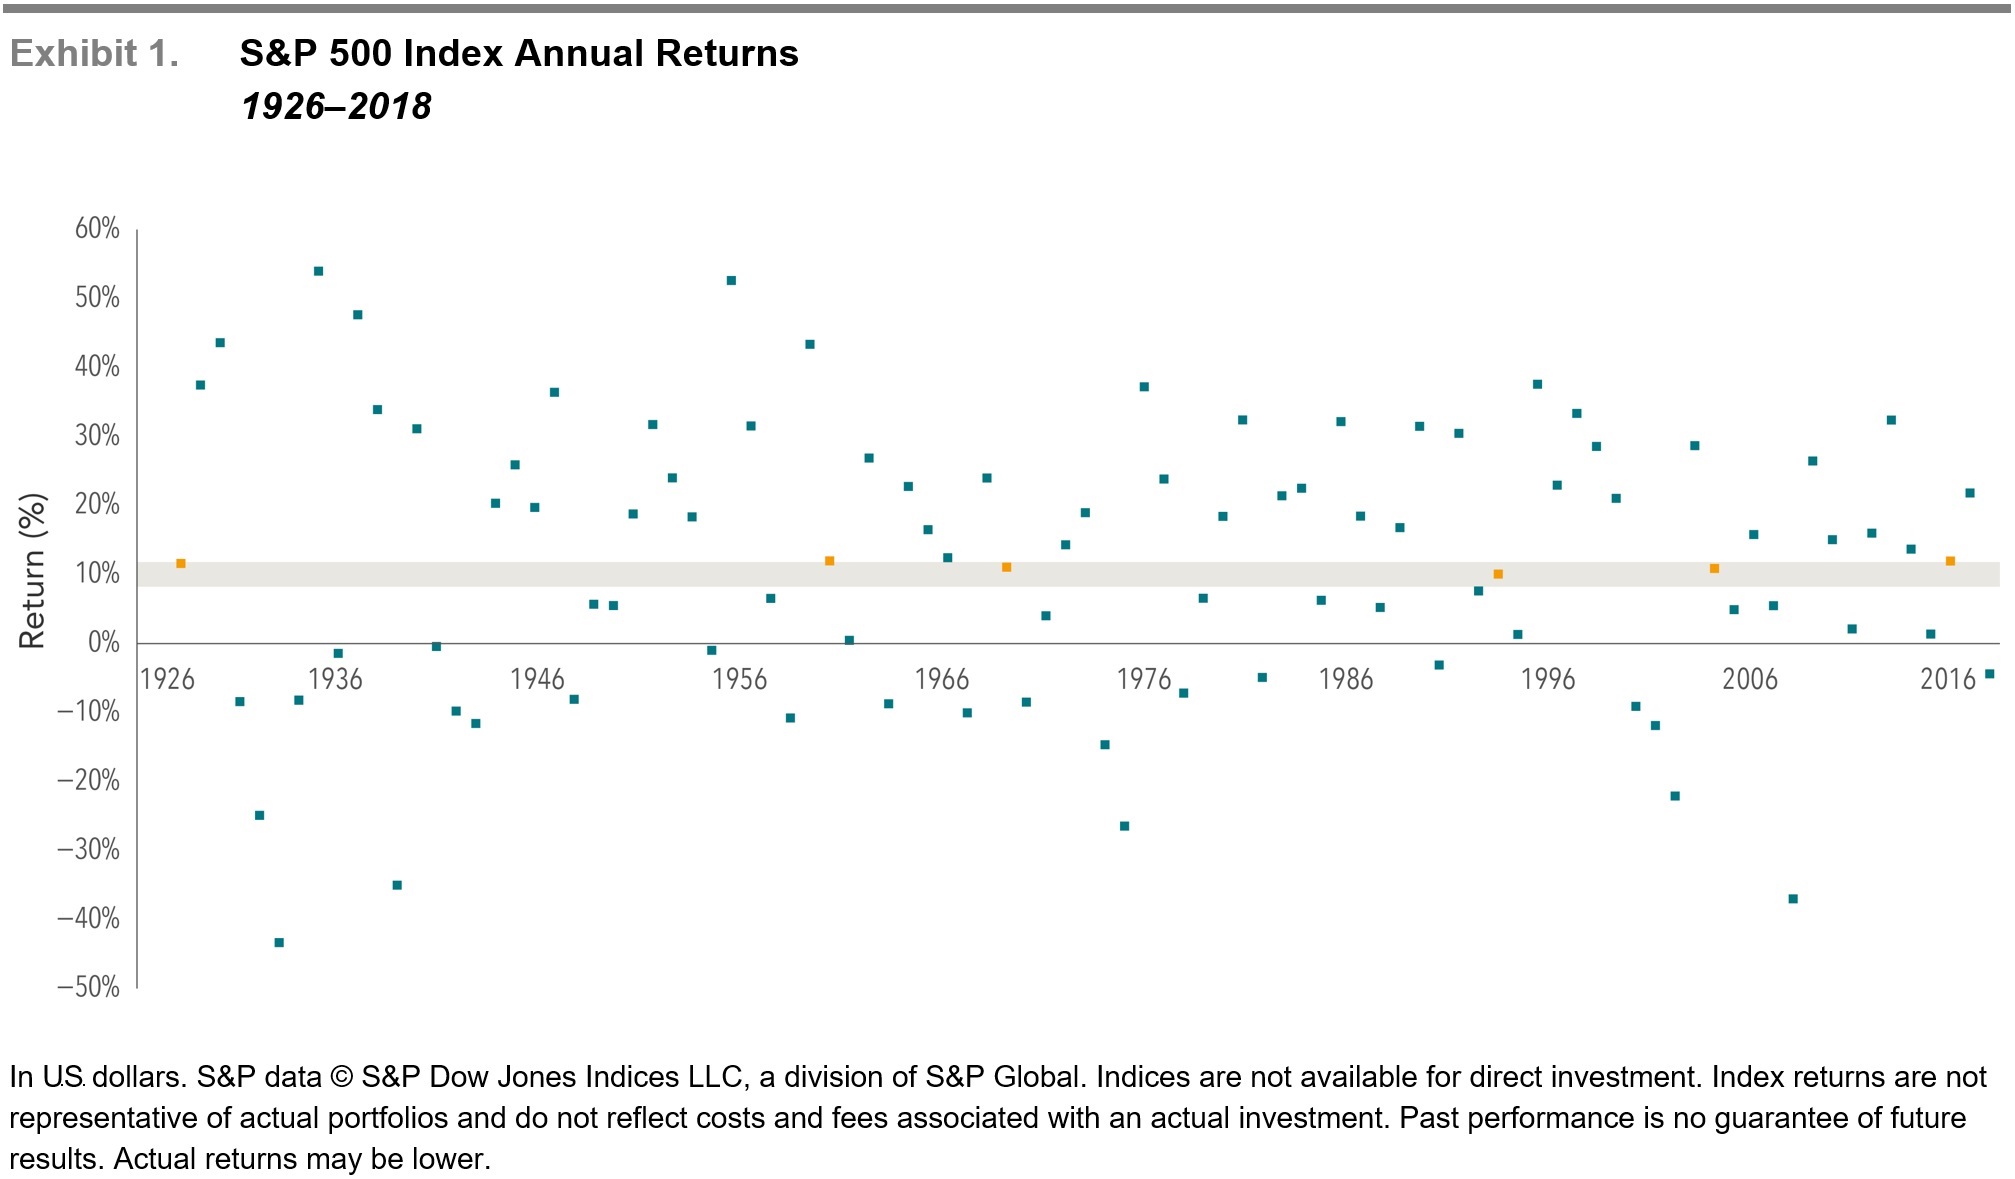
Exhibit 1, below, shows calendar year returns for the S&P 500 Index since 1926. The shaded band marks the historical average of 10%, plus or minus 2 percentage points. The S&P 500 Index had a return within this range in only six of the past 93 calendar years. In most years, the index’s return was outside of the range—often above or below by a wide margin—with no obvious pattern. For investors, the data highlights the importance of looking beyond average returns and being aware of the range of potential outcomes.

Tuning in to Different Frequencies:
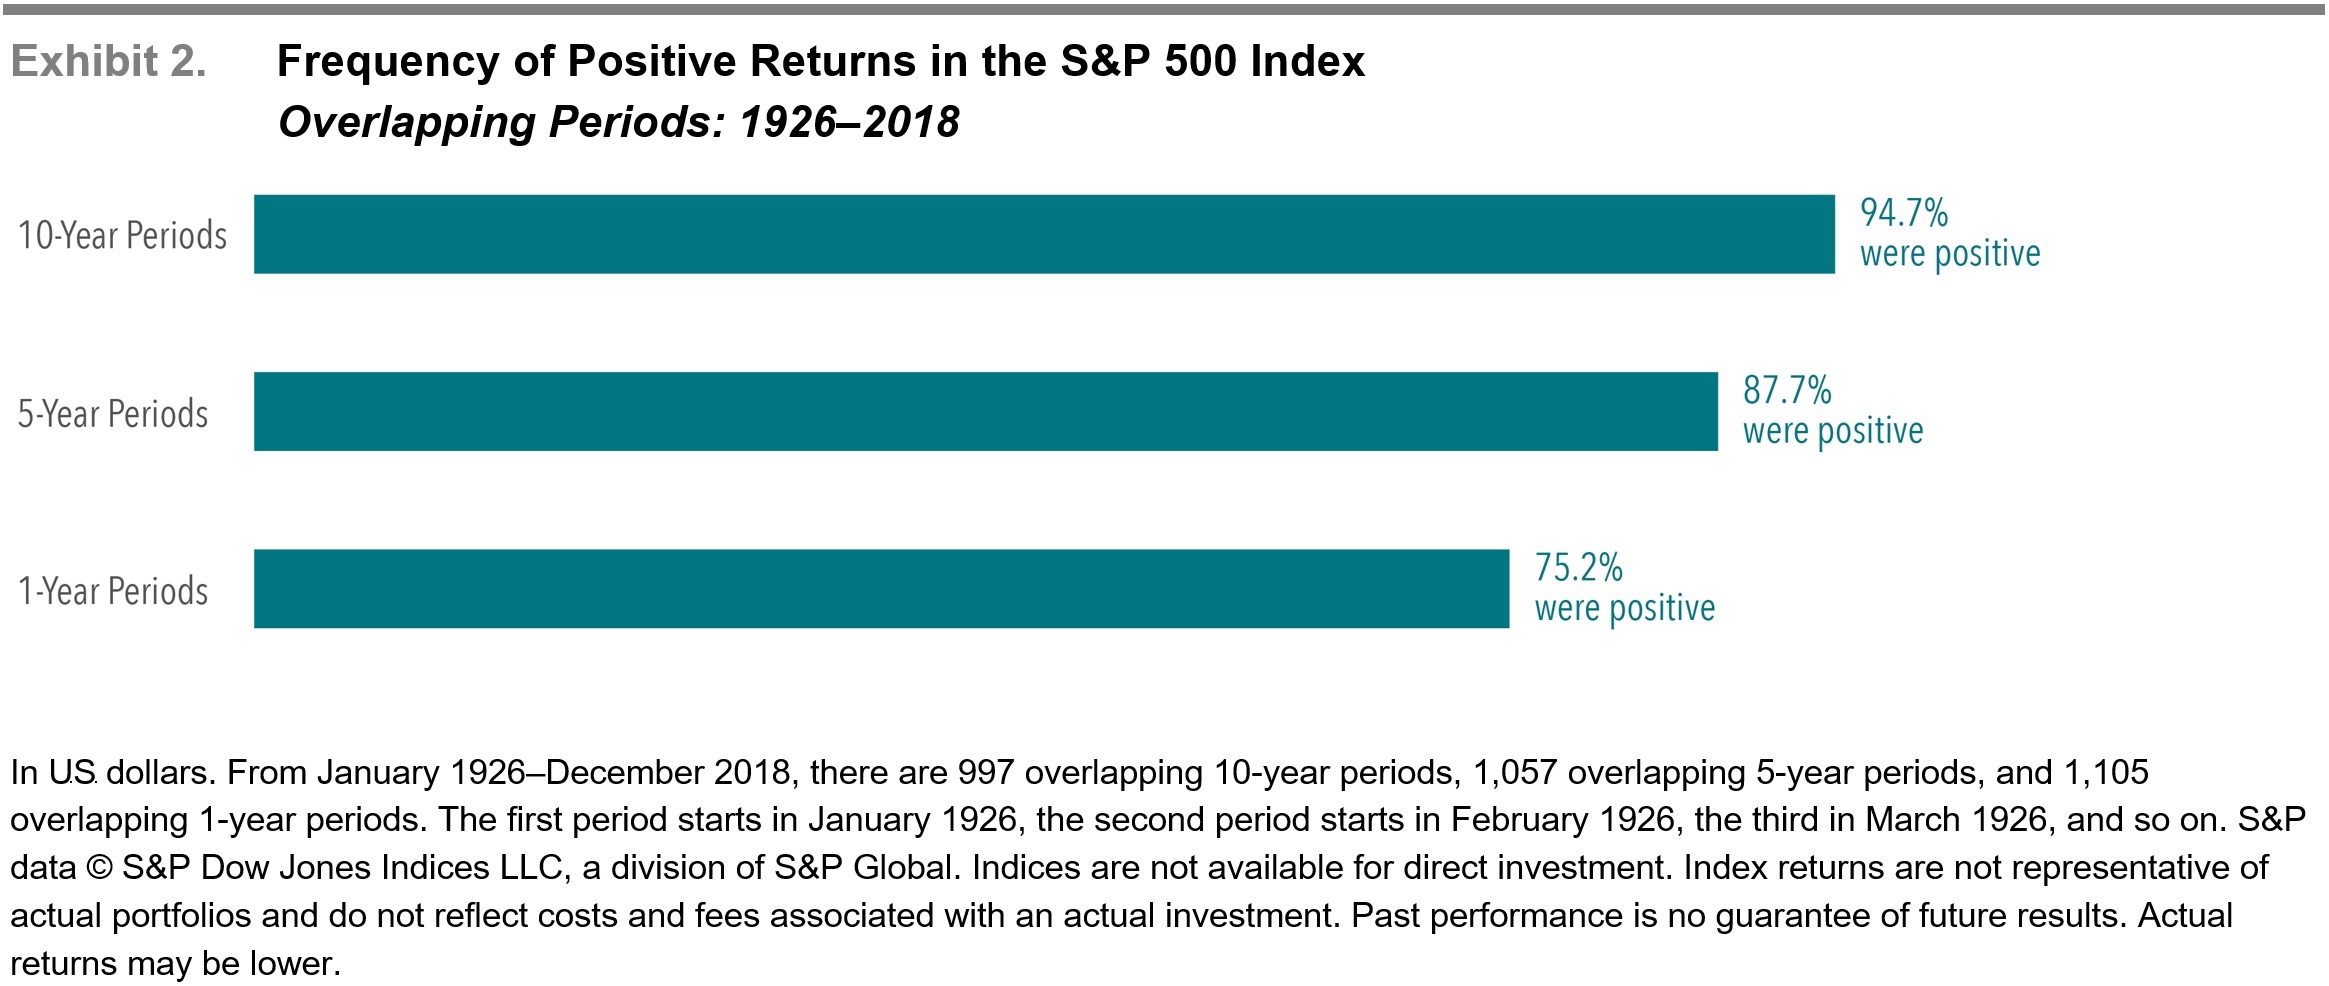
Despite year-to-year volatility, investors can potentially increase their chances of having a positive outcome by maintaining a long-term focus. Exhibit 2, below, documents the historical frequency of positive returns over rolling periods of one, five, and 10 years in the U.S. market. The data shows that, while positive performance is never assured, investors’ odds improve over longer time horizons.

Recession Myths and Realities:
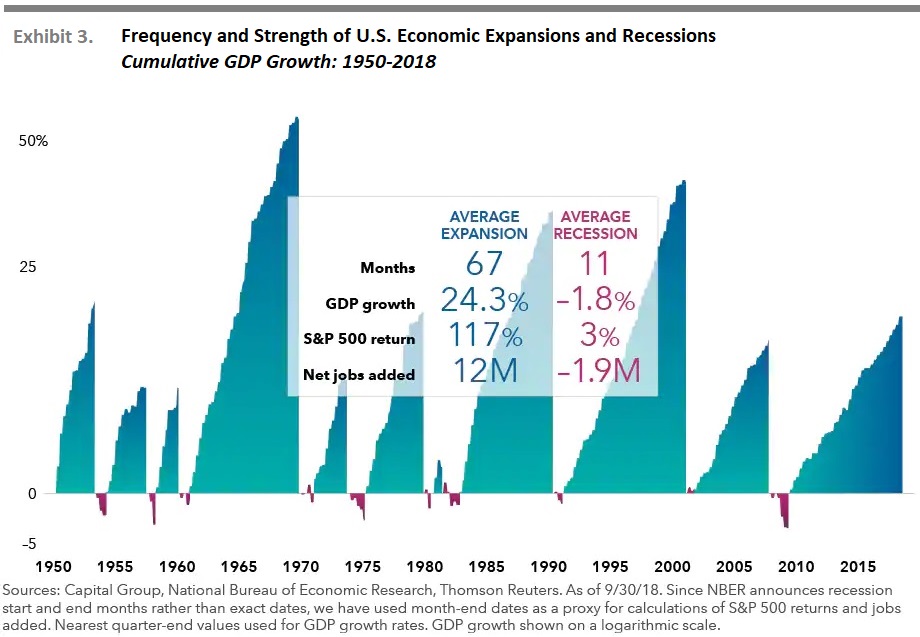
As much as the financial news and market pundits talk about the possibility of a pending recession, few news reports give the statistics for the frequency and length of economic expansions and recessions. While the statistics for recessions vary depending on when the measurement period is started, Exhibit 3, below, provides the statistics for the average expansion and recession since 1950.
There are three points to consider from viewing these statistics:
• Recessions have been infrequent—the U.S. has been in an official recession less than 15% of all months since 1950
• Recessions have been relatively short—the current economic expansion has been longer than the last 10 recessions combined
• Recessions have been less impactful compared with expansions—the average recession led to a contraction of -2% while an expansion grew the economy by an average of about 24%

Staying Focused:
While some investors might find it easy to stay the course in years with above-average returns, periods of substantially disappointing results may test an investor’s faith in equity markets. Being aware of the range of potential outcomes can help investors remain disciplined, which in the long term can increase the odds of a successful investment experience.
What can help investors endure the ups and downs? While there is no silver bullet, understanding how markets work and trusting market prices are good starting points. An asset allocation that aligns with personal risk tolerances and investment goals is also valuable. By thoughtfully considering these and other issues, investors may be better prepared to stay focused on their long-term goals during different market environments.
[1] As measured by the S&P 500 Index from 1926-2018.
Past performance does not guarantee future results. All investments include risk and have the potential for loss as well as gain.
Data sources for returns and standard statistical data are provided by the sources referenced and are based on data obtained from recognized statistical services or other sources we believe to be reliable. However, some or all information has not been verified prior to the analysis, and we do not make any representations as to its accuracy or completeness. Any analysis nonfactual in nature constitutes only current opinions, which are subject to change. Benchmarks or indices are included for information purposes only to reflect the current market environment; no index is a directly tradable investment. There may be instances when consultant opinions regarding any fundamental or quantitative analysis do not agree.
The commentary contained herein has been compiled by W. Reid Culp, III from sources provided by TAGStone Capital, Capital Directions, DFA, Vanguard, Morningstar, as well as commentary provided by Mr. Culp, personally, and information independently obtained by Mr. Culp. The pronoun “we,” as used herein, references collectively the sources noted above.
TAGStone Capital, Inc. provides this update to convey general information about market conditions and not for the purpose of providing investment advice. Investment in any of the companies or sectors mentioned herein may not be appropriate for you. You should consult your advisor from TAGStone for investment advice regarding your own situation.
