
High Inflation and Potential Depth of a Bear Market
Leading financial headlines are inflation, recession, and the potential depth of a bear market. This article will address inflation’s impact on the chances of a recession, the correlation between recessions and stock market valuations (measured as the S&P 500 throughout the article), and market timing in the face of a recession.
What is a Recession?
A definition of a recession commonly used in the media is two consecutive quarters of a shrinking gross domestic product (GDP). Recessions have been infrequent. The U.S. has been in an official recession for less than 15% of all months since 1950.
Recessions have been relatively short, lasting on average about eleven months.[i] On the other hand, economic expansions typically last about five and a half years. For example, the 2009-2020 economic expansion was longer than the prior ten recessions combined. Finally, recessions have been less impactful compared with expansions. The average recession contracted GDP by less than 2%, while an expansion grew the economy by about 25%.
Does Inflation Cause a Recession?
You may recall a few months ago that the Federal Reserve thought inflation would be “transitory” and would gradually return to the Fed’s long-term 2% inflation target. However, inflation has proved to be more persistent, which has charged the Federal Reserve with the task of raising interest rates and tightening financial conditions to get
inflation back under control. If Fed Chair Jerome Powell cannot implement a “soft landing” (aka slow the economy just enough to lower inflation), the U.S. economy may fall into a recession.
Why is a Recession Important?
In stock investing, a recession is important because it will likely lead to a substantial bear market. Bear markets can be challenging for stock investors to navigate if they last longer than a few months. Investors may sell stocks, move the proceeds to “safer” investments such as money market funds, and not buy back into stocks until they have risen above where the investor sold out. This is known as “selling out at the bottom.”
However, like recessions, bear markets have historically been blips in the context of an investment lifetime. In 1980, the last time the Federal Reserve raised interest rates aggressively to cool inflation, it caused a recession. However, by 1983, inflation had dropped closer to its 2% target rate, where it mostly hovered for the next 40 years. This period coincided with the start of the greatest bull market of all time—from August 1982 until March 2000.
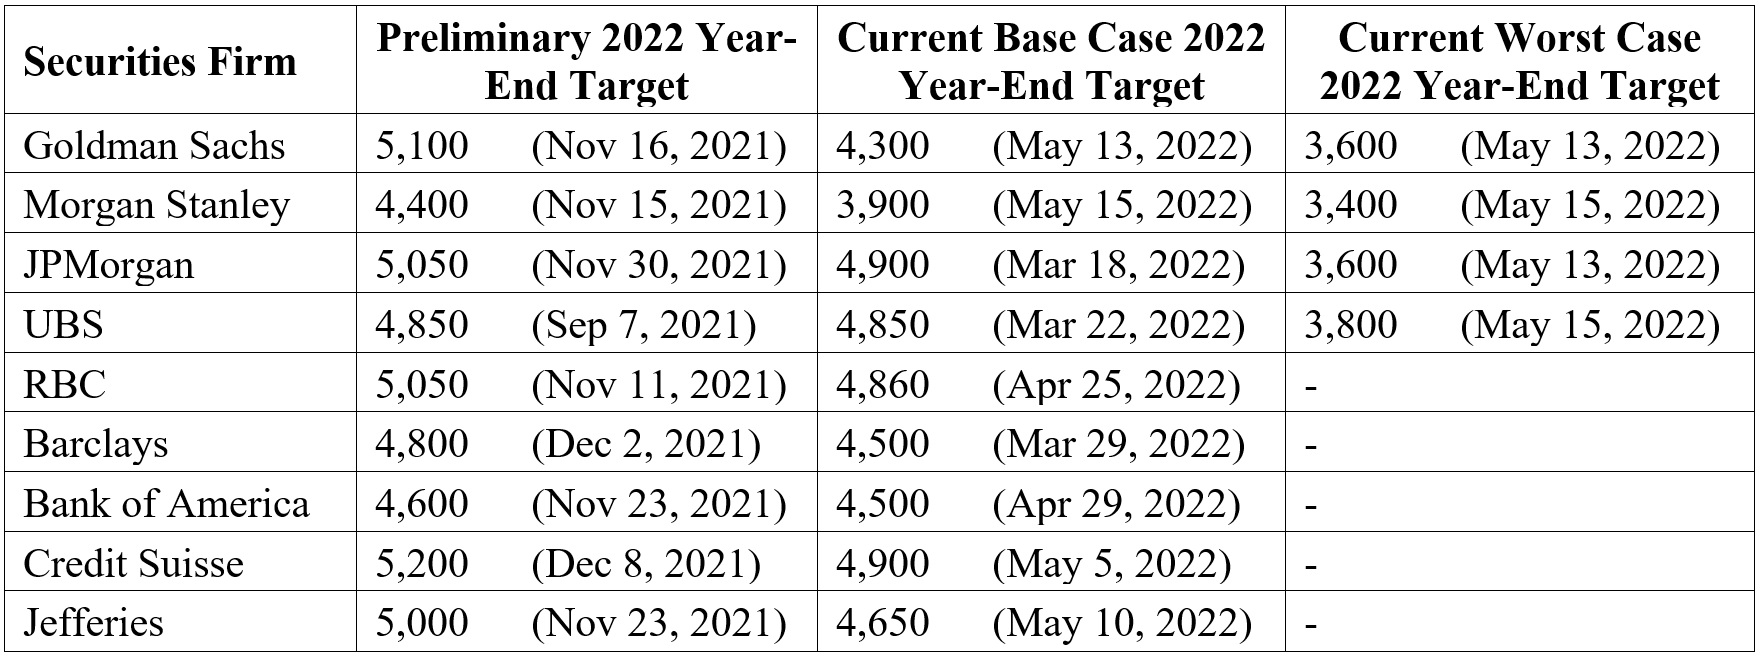
Where does Wall Street think the S&P 500 will end in 2022?
Some of the world’s best and brightest stock market analysts made the following projections for the 2022 year-end value of the S&P 500 on the dates specified:[ii]
What is a Stock Market Correction?
A stock market correction is a decline from the recent peak of greater than 10% but less than 20%. The value of the S&P 500 generally surpasses its pre-correction peak within several months after a correction begins. Corrections are generally considered healthy because they can force speculators out of the market and tend to keep stocks from becoming overpriced.
Remember that at least since 1980, there has been an average annual peak-to-trough correction in the S&P 500 of about 14%.[iii] However, the S&P 500 at the start of 1980 was 106, and at the end of April 2022, it was 4,132.[iv] The S&P 500 ended each calendar year since 1980 positive about 75% of the time.
Legendary fund manager Peter Lynch famously said in his book “Learn to Earn” that “Far more money has been lost by investors trying to anticipate corrections than has been lost in all the corrections combined.”[v]
What is a Bear Market?
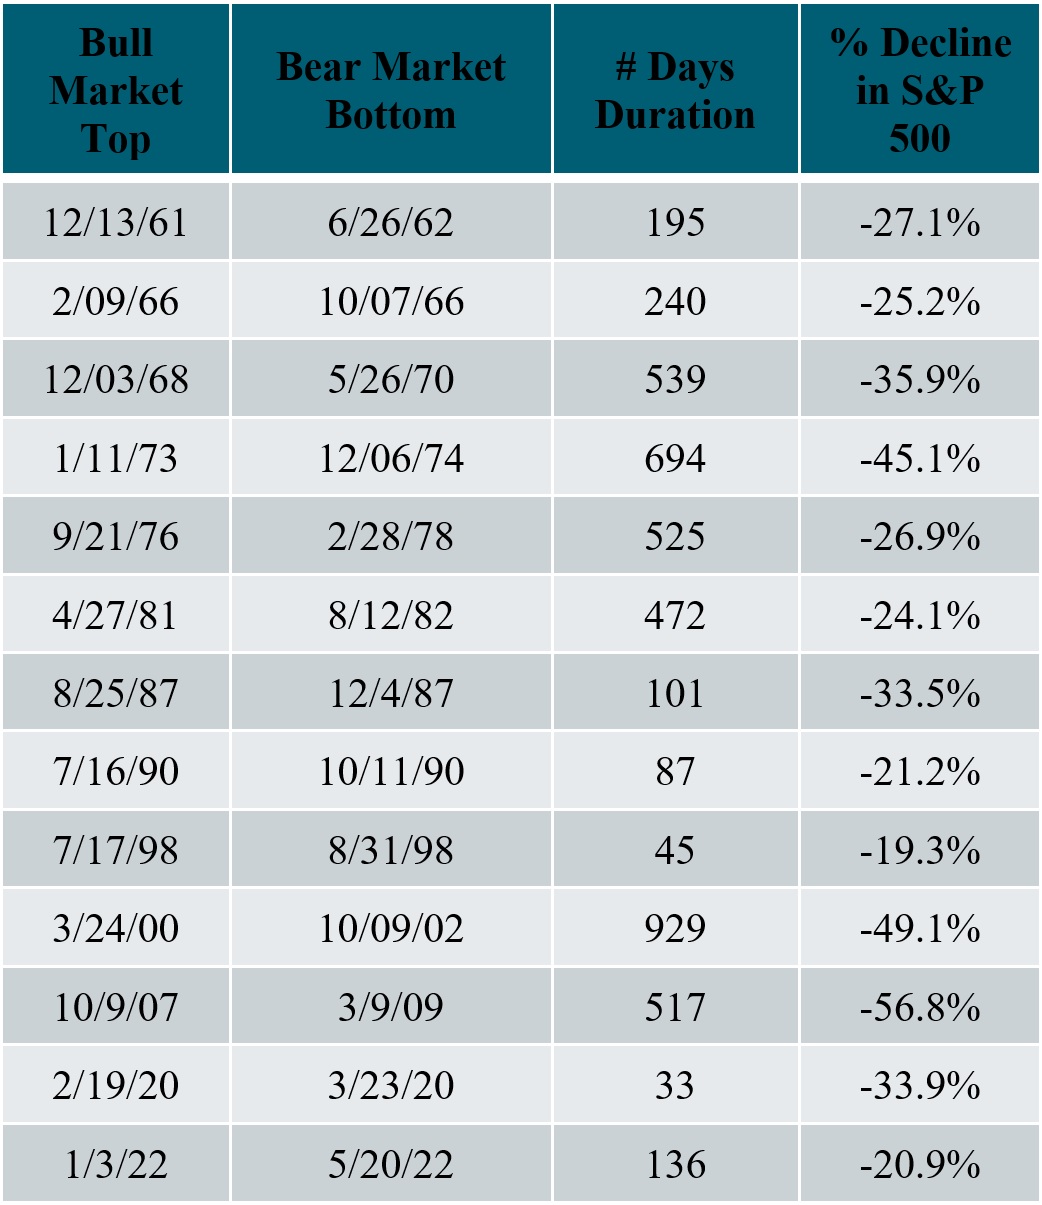
As you may know, the S&P 500 briefly touched bear market territory, which is a stock market decline from the last peak of greater than 20% but is now back above that level. As shown in the table below, since 1960, the S&P 500 has experienced thirteen bear markets (including the current bear market), or about one every five years. Three of the bear markets since 1960 have been greater than -45%, as measured by the S&P 500. Since 1960, the most significant bear market decline in the S&P 500 was -56.8% during the 2008-2009 Great Financial Crisis, and the average bear market decline has been -32.2%.
Timing the Market
Most people intuitively understand that it would be desirable to sell stocks before a decline and repurchase them before the price increases. Unfortunately, this is notoriously difficult.
Someone is always predicting a recession is imminent, whether in the next three months or three years. It is possible that they may be right this time. However, no one has been shown to be consistently correct in predicting recessions.
As measured by the S&P 500, predicting the stock market’s price is even more difficult because the stock market has not been shown to be closely correlated with the blips in the U.S. economy—meaning the stock market does not go up and down in tandem with a recession. The stock market tends to be forward-looking and discounts the chances of a recession well before a recession begins and bottoms out and increases in value much sooner than a recession ends. Since 1945, every recession has prompted a bear market, but not all bear markets were followed by a recession.[vi]
The table below is a chart detailing the beginning date, ending date, and the total decline of every bear market in the S&P 500 since 1960.[vii] The chart is a frightening sight for investors. However, it is essential to remember that on the first trading day of 1960, the S&P 500 traded at 60. On the last trading day of April 2022, the S&P 500 closed at 4,132.[viii]
Investors should find solace that from 1960 until April 30, 2022, the average annual compound rate of return of a 60/40 portfolio invested 60% in the S&P 500 and 40% in One-Month U.S. Treasury Bills was 8.13%.[ix] The return of a 60/40 portfolio during this period is slightly higher than the long-term (96-year) average of 7.85% of a similarly constituted 60/40 portfolio.
The S&P 500 is significantly more volatile than a 60/40 portfolio, but someone invested in the S&P 500 from January 1960 to April 2022 would have earned 10.23%. The average return of the S&P 500 over the past 96 years has been 10.27%. While it is exceedingly difficult to time a bear market, it turns out you would not have needed to time the market to have a successful investment experience during these periods.