Why Should You Diversify? – Fourth Quarter 2018

Why Should You Diversify?

As 2019 begins, and with U.S. stocks outperforming non-U.S. stocks in recent years, some investors have again turned their attention towards the role that global diversification plays in their portfolios.

For the five-year period ending October 31, 2018, the S&P 500 Index had an annualized return of 11.34% while the MSCI World ex USA Index returned 1.86%, and the MSCI Emerging Markets Index returned 0.78%. As U.S. stocks have outperformed international and emerging markets stocks over the last several years, some investors might be reconsidering the benefits of investing outside the U.S.

While there are many reasons why a U.S.-based investor may prefer a degree of home bias in their equity allocation, using return differences over a relatively short period as the sole input into this decision may result in missing opportunities that the global markets offer. While international and emerging markets stocks have delivered disappointing returns relative to the U.S. over the last few years, it is important to remember that:

1.     Non-U.S. stocks help provide valuable diversification benefits.

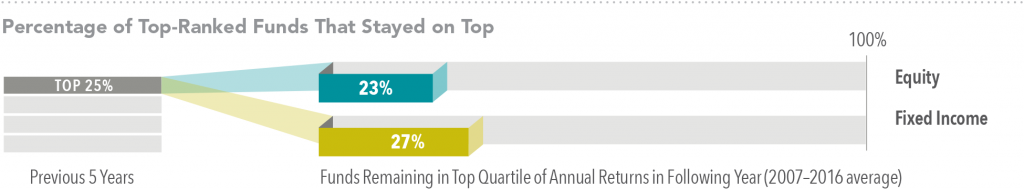
2.     Recent performance is not a reliable indicator of future returns.

There's a World of Opportunity in Equities

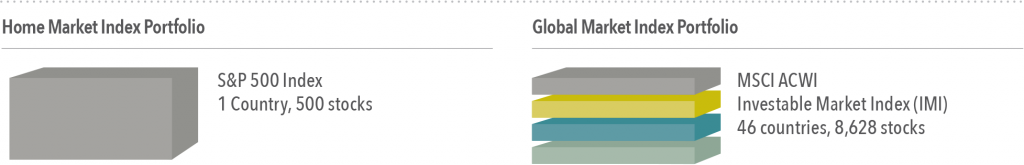
The global equity market is large and represents a world of investment opportunities. As shown in Exhibit 1, nearly half of the investment opportunities in global equity markets lie outside the U.S. Non-U.S. stocks, including developed and emerging markets, account for 48% of world market capitalization1 and represent thousands of companies in countries all over the world. A portfolio investing solely within the U.S. would not be exposed to the performance of those markets.

The Lost Decade

We can examine the potential opportunity cost associated with failing to diversify globally by reflecting on the period in global markets from 2000–2009. During this period, often called the “lost decade” by U.S. investors, the S&P 500 Index recorded its worst ever 10-year performance with a total cumulative return of –9.1%. However, looking beyond U.S. large-cap equities, conditions were more favorable for global equity investors as most equity asset classes outside the U.S. generated positive returns over the course of the decade. (See Exhibit 2.) Expanding beyond this period and looking at performance for each of the 11 decades starting in 1900 and ending in 2010, the U.S. market outperformed the world market in five decades and underperformed in the other six.2  This further reinforces why an investor pursuing the equity premium should consider a global allocation. By holding a globally diversified portfolio, investors position themselves to capture returns wherever they occur.
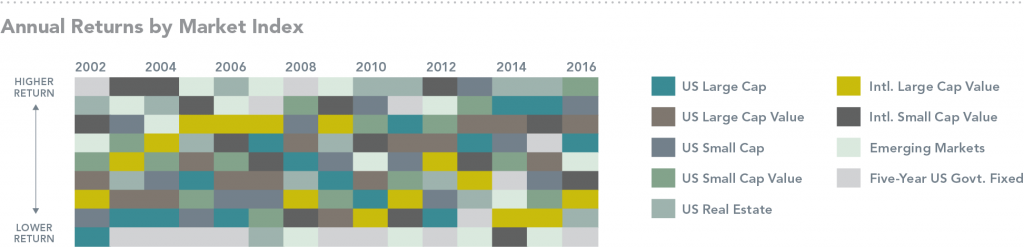
 

Pick a Country?

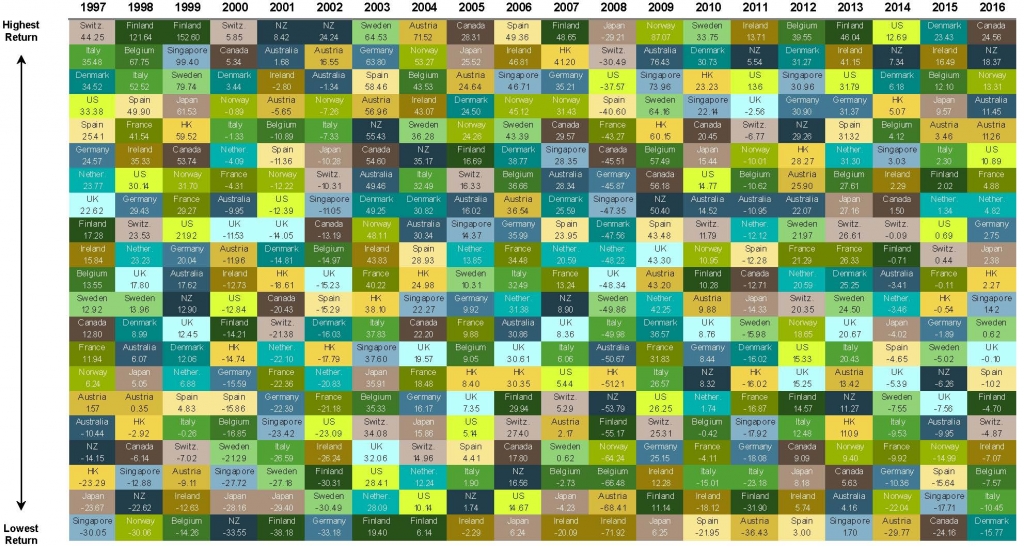
Are there systematic ways to identify which countries will outperform others in advance? Exhibit 3 illustrates the randomness in country equity market rankings (from highest to lowest) for 22 different developed market countries over the past 20 years. This graphic conveys how difficult it would be to execute a strategy that relies on picking the best country and the resulting importance of diversification.

In addition, concentrating a portfolio in any one country can expose investors to large variations in returns. The difference between the best- and worst performing countries can be significant. For example, since 1998, the average return of the best performing developed market country was approximately 44%, while the average return of the worst-performing country was approximately –16%. Diversification means an investor’s portfolio is unlikely to be the best or worst performing relative to any individual country, but diversification also provides a means to achieve a more consistent outcome and more importantly helps reduce and manage catastrophic losses that can be associated with investing in just a few stocks or a single country.

A Diversified Approach

Over long periods of time, investors may benefit from consistent exposure in their portfolios to both U.S. and non-U.S. equities. While both asset classes offer the potential to earn positive expected returns in the long run, they may perform quite differently over short periods. While the performance of different countries and asset classes will vary over time, there is no reliable evidence that this performance can be predicted in advance. An approach to equity investing that uses the global opportunity set available to investors can provide diversification benefits as well as potentially higher expected returns.

1. The total market value of a company’s outstanding shares computed as price times shares outstanding.

2. Source: Annual country index return data from the Dimson-Marsh-Staunton (DMS) Global Return Data, provided by Morningstar, Inc.


Past performance does not guarantee future results. All investments include risk and have the potential for loss as well as gain.

Data sources for returns and standard statistical data are provided by the sources referenced and are based on data obtained from recognized statistical services or other sources we believe to be reliable. However, some or all information has not been verified prior to the analysis, and we do not make any representations as to its accuracy or completeness. Any analysis nonfactual in nature constitutes only current opinions, which are subject to change. Benchmarks or indices are included for information  purposes  only  to  reflect  the  current  market  environment;  no  index  is  a directly  tradable  investment.  There  may  be  instances  when  consultant  opinions  regarding any fundamental or quantitative analysis do not agree.

The  commentary  contained  herein  has  been  compiled  by  W.  Reid  Culp,  III  from  sources  provided  by  TAGStone  Capital,  Capital  Directions,  DFA,  Vanguard,  Morningstar,  as  well  as  commentary  provided  by  Mr.  Culp,  personally,  and  information  independently  obtained  by  Mr.  Culp.  The  pronoun  “we,”  as  used  herein,  references collectively the sources noted above.

TAGStone Capital, Inc. provides this update to convey general information about market conditions and not for the purpose of providing investment advice. Investment in any of the companies or sectors mentioned herein may not be appropriate for you. You should consult your advisor from TAGStone for investment advice regarding your own situation.


Where's the Value?

From 1928–2017 the value premium1 in the U.S. had a positive annualized return of approximately 3.5%.2 In seven of the last 10 calendar years, however, the value premium in the U.S. has been negative.

This has prompted some investors to wonder if such an extended period of underperformance may be cause for concern. But are periods of underperformance in the value premium that unusual? We can look to history to help make sense of this question.

Short-Term Results

Exhibit 1 shows yearly observations of the U.S. value premium going back to 1928. We can see the annual arithmetic average for the premium is close to 5%, but in any given year the premium has varied widely, sometimes experiencing extreme positive or negative performance. In fact, there are only a handful of years that were within a 2% range of the annual average—most other years were farther above or below the mean. In the last 10 years alone there have been premium observations that were negative, positive, and in line with the historical average. This data helps illustrate that there is a significant amount of variability around how long it may take a positive value premium to materialize.

Long-Term Results

But what about longer-term underperformance? While the current stretch of extended underperformance for the value premium may be disappointing, it is not unprecedented. Exhibit 2 documents 10-year annualized performance periods for the value premium, sorted from lowest to highest by end date (calendar year). The earliest 10-year period in the series began in 1928 and ended in 1937.

This chart shows us that the best 10-year period for the value premium was from 1941–1950 (at the top), while the worst was from 1930–1939 (at the bottom). In most cases, we can see that the value premium was positive over a given 10-year period. As the arrow indicates, however, the value premium for the most recent 10-year period (ending in 2017) was negative. To put this in context, the most recent 10 years is one of only 13 periods since 1937 that had a negative annualized value premium. Of these, the most recent period of underperformance has been fairly middle-of-the-road in magnitude.

Frequency of Long-Term Results

While there is uncertainty around how long periods of underperformance may last, historically the frequency of a positive value premium has increased over longer time horizons. Exhibit 3 shows the percentage of time that the value premium was positive over different time periods going back to 1926. When the length of time measured increased, the chance of a positive value premium increased. For example, when the time period measured goes from five years to 10 years, the frequency of positive average premiums increased from 75% to 84%.

Maintaining Consistency

What does all this mean for investors? While a positive value premium is never guaranteed, the premium has historically had a greater chance of being positive the longer the time horizon observed. Even with long-term positive results though, periods of extended underperformance can happen from time to time. Because the value premium has not historically materialized in a steady or predictable fashion, a consistent investment approach that maintains an emphasis on value stocks in all market environments may allow investors to more reliably capture the premium over the long run. Additionally, keeping implementation costs low and integrating multiple dimensions of expected stock returns (such as size and profitability) can improve the consistency of expected outperformance.

[1] The value premium is the return difference between stocks with low relative prices (value) and stocks with high relative prices (growth).

[2] Computed as the return difference between the Fama/French U.S. Value Research Index and the Fama/French U.S. Growth Research Index. Fama/French indices provided by Ken French.


Past performance does not guarantee future results. All investments include risk and have the potential for loss as well as gain.

Data sources for returns and standard statistical data are provided by the sources referenced and are based on data obtained from recognized statistical services or other sources we believe to be reliable. However, some or all information has not been verified prior to the analysis, and we do not make any representations as to its accuracy or completeness. Any analysis nonfactual in nature constitutes only current opinions, which are subject to change. Benchmarks or indices are included for information  purposes  only  to  reflect  the  current  market  environment;  no  index  is  a directly  tradable  investment.  There  may  be  instances  when  consultant  opinions  regarding any fundamental or quantitative analysis do not agree.

The  commentary  contained  herein  has  been  compiled  by  W.  Reid  Culp,  III  from  sources  provided  by  TAGStone  Capital,  Capital  Directions,  DFA,  Vanguard,  Morningstar,  as  well  as  commentary  provided  by  Mr.  Culp,  personally,  and  information  independently  obtained  by  Mr.  Culp.  The  pronoun  “we,”  as  used  herein,  references collectively the sources noted above.

TAGStone Capital, Inc. provides this update to convey general information about market conditions and not for the purpose of providing investment advice. Investment in any of the companies or sectors mentioned herein may not be appropriate for you. You should consult your advisor from TAGStone for investment advice regarding your own situation.


E + R = O, a Formula for Success

Combining an enduring investment philosophy with a simple formula that helps maintain investment discipline can increase the odds of having a positive financial experience.

"The important thing about an investment philosophy is that you have one you can stick with.”

David Booth
Founder and Executive Chairman
Dimensional Fund Advisors

An Enduring Investment Philosophy

Investing is a long-term endeavor. Indeed, people will spend decades pursuing their financial goals. But being an investor can be complicated, challenging, frustrating, and sometimes frightening. This is exactly why, as David Booth says, it is important to have an investment philosophy you can stick with, one that can help you stay the course.

This simple idea highlights an important question: How can investors maintain discipline through bull markets, bear markets, political strife, economic instability, or whatever crisis du jour threatens progress towards their investment goals?

Over their lifetimes, investors face many decisions, prompted by events that are both within and outside their control. Without an enduring philosophy to inform their choices, they can potentially suffer unnecessary anxiety, leading to poor decisions and outcomes that are damaging to their long-term financial well-being.

When they don’t get the results they want, many investors blame things outside their control. They might point the finger at the government, central banks, markets, or the economy. Unfortunately, the majority will not do the things that might be more beneficial—evaluating and reflecting on their own responses to events and taking responsibility for their decisions.

e + r = o

Some people suggest that among the characteristics that separate highly successful people from the rest of us is a focus on influencing outcomes by controlling their reactions to events, rather than the events themselves. This relationship can be described in the following formula1:

e + r = o (Event + Response = Outcome)

Simply put, this means an outcome—either positive or negative—is the result of how you respond to an event, not just the result of the event itself. Of course, events are important and influence outcomes, but not exclusively. If this were the case, everyone would have the same outcome regardless of their response.

Let’s think about this concept in a hypothetical in

investment context. Say a major political surprise, such as Brexit, causes a market to fall (“event’). In a panicked response, potentially fueled by gloomy media speculation of the resulting uncertainty, an investor sells some or all of his or her investment (“response”). Lacking a long-term perspective and reacting to the short-term news, our investor misses out on the subsequent market recovery and suffers anxiety about when, or if, to get back in, leading to suboptimal investment returns (“outcome”).

To see the same hypothetical example from a different perspective, a surprise event causes markets to fall suddenly (“e”). Based on his or her understanding of the long-term nature of returns and the short-term nature of volatility spikes around news events, an investor is able to control his or her emotions (“r’) and maintain investment discipline, leading to a higher chance of a successful long‑term outcome (“o”).

This example reveals why having an investment philosophy is so important. By understanding how markets work and maintaining a long-term perspective on past events, investors can focus on ensuring that their responses to events are consistent with their long-term plan.

The Foundation of an Enduring Philosophy

An enduring investment philosophy is built on solid principles backed by decades of empirical academic evidence. Examples of such principles might be:

-- trusting that prices are set to provide a fair expected return;

-- recognizing the difference between investing and speculating;

-- relying on the power of diversification to manage risk and increase the reliability of outcomes; and

-- benchmarking your progress against your own realistic long-term investment goals.

Combined, these principles might help us react better to market events, even when those events are globally significant or when, as some might suggest, a paradigm shift has occurred, leading to claims that “it’s different this time.” Adhering to these principles can also help investors resist the siren calls of new investment fads or worse, outright scams.

The Guiding Hand of a Trusted Advisor

Without education and training—sometimes gained from bitter experience—it is hard for non-investment professionals to develop a cogent investment philosophy. And even the most self-aware find it hard to manage their own responses to events. This is why a financial advisor can be so valuable—by providing the foundation of an investment philosophy and acting as an experienced counselor when responding to events. 

Investing will always be both alluring and scary at times, but a view of how to approach investing combined with the guidance of a professional advisor can help people stay the course through challenging times. Advisors can provide an objective view and help investors separate emotions from investment decisions. Moreover, great advisors can educate, communicate, set realistic financial goals, and help their clients deal with their responses even to the most extreme market events.

In the spirit of the “e + r = o” formula, good advice, driven by a sound philosophy, can help increase the probability of having a successful financial outcome.2

Markets Have Rewarded Discipline

As we head into the election season, a look back at past-market crises can serve as an important reminder for investors today. As we have discussed before, the intra-year decline of the S&P 500 Index of large U.S. stocks has averaged 14.1% since 1980. That is the decline from the market high to the market low in any given 12-month calendar year.

However, as seen in the table below, the average intra-year decline of the S&P 500 Index during midterm election years, like 2018, is much higher. In midterm election years, the intra-year decline of the S&P 500 Index has averaged 16.9% since 1950.

For many, feelings of elation or despair can go with headlines leading up to and after controversial elections. We should remember that markets can be

volatile and recognize that, in the moment, doing nothing may feel paralyzing. Throughout these ups and downs, however, if one had hypothetically invested $10,000 in a globally diversified portfolio of stocks in January 1970 and stayed invested, that investment would be worth about $590,000 at the end of 2017.

[1] Jack Canfield, The Success Principles: How to Get from Where You Are to Where You Want to Be (New York: HarperCollins Publishers, 2004).

[2] Adapted from “E+R=O, a Formula for Success,” The Front Foot Adviser, by David Jones, Vice President and Head of Financial Adviser Services, EMEA.


Past performance does not guarantee future results. All investments include risk and have the potential for loss as well as gain.

Data sources for returns and standard statistical data are provided by the sources referenced and are based on data obtained from recognized statistical services or other sources we believe to be reliable. However, some or all information has not been verified prior to the analysis, and we do not make any representations as to its accuracy or completeness. Any analysis nonfactual in nature constitutes only current opinions, which are subject to change. Benchmarks or indices are included for information  purposes  only  to  reflect  the  current  market  environment;  no  index  is  a directly  tradable  investment.  There  may  be  instances  when  consultant  opinions  regarding any fundamental or quantitative analysis do not agree.

The  commentary  contained  herein  has  been  compiled  by  W.  Reid  Culp,  III  from  sources  provided  by  TAGStone  Capital,  Capital  Directions,  DFA,  Vanguard,  Morningstar,  as  well  as  commentary  provided  by  Mr.  Culp,  personally,  and  information  independently  obtained  by  Mr.  Culp.  The  pronoun  “we,”  as  used  herein,  references collectively the sources noted above.

TAGStone Capital, Inc. provides this update to convey general information about market conditions and not for the purpose of providing investment advice. Investment in any of the companies or sectors mentioned herein may not be appropriate for you. You should consult your advisor from TAGStone for investment advice regarding your own situation.


Sailing with the Tides

Embarking on a financial plan is like sailing around the world. The voyage won’t always go according to plan, and there’ll be rough seas. But the odds of reaching your destination increase greatly if you are prepared, flexible, patient, and well-advised.

A mistake many inexperienced sailors make is not having a plan at all. They embark without a clear sense of their destination. And once they do decide, they often find themselves lost at sea in the wrong boat with inadequate provisions.

Likewise, in planning an investment journey, you need to decide on your goal. A first step might be to consider whether the goal is realistic and achievable. For instance, while you may long to retire in the south of France, you may not be prepared to sacrifice your needs today to satisfy that distant desire.

Sailing with the Tides (Continued)

Once you are set on a realistic destination, you need to ensure you have the right portfolio to get you there. Have you planned for multiple contingencies? What degree of “bad weather” can your plan withstand along the way?

Key to a successful voyage is a good navigator. A trusted advisor is like that, regularly taking coordinates and making adjustments, if necessary. If your circumstances change, the advisor may suggest you replot your course.

As with the weather at sea, markets can be unpredictable. A sudden squall can whip up waves of volatility, tides can shift, and strong currents can threaten to blow you off course. Like a seasoned sailor, an experienced advisor will work with the conditions.

Exhibit 1. A recent survey conducted by Dimensional Fund Advisors found that, along with progress towards their goals, investors place a high value on the sense of security they receive from their relationship with a financial advisor.

Sailing with the Tides (Continued)

Once the storm passes, you can pick up speed again. Just as a sturdy vessel will help you withstand most conditions at sea, a well-diversified portfolio can act as a bulwark against the sometimes tempestuous conditions in markets.

Circumnavigating the globe is not exciting every day. Patience is required with local customs and paperwork as you pull into different ports. Likewise, a lack of attention to costs and taxes is the enemy of many a long-term financial plan.

Distractions can also send investors, like sailors, off course. In the face of “hot” investment trends, it takes discipline not to veer from your chosen plan. Like the sirens of Greek mythology, media pundits can also be diverting, tempting you to change tack and act on news that is already priced into markets.

A lack of flexibility is another impediment to a successful investment journey. If it doesn’t look as though you’ll make your destination in time, you may have to extend your voyage, take a different route to get there, or even moderate your goal.

Sailing with the Tides (Continued)

The important point is that you become comfortable with the idea that uncertainty is inherent to the investment journey, just as it is with any sea voyage. That is why preparation and planning are so critical. While you can’t control every outcome, you can be prepared for the range of possibilities and understand that you have clear choices if things don’t go according to plan.

If you can’t live with the volatility, you can change your plan. If the goal looks unachievable, you can lower your sights. If it doesn’t look as if you’ll arrive on time, you can extend your journey.

Of course, not everyone’s journey is the same. Neither is everyone’s destination. We take different routes to different places, and we meet a range of challenges and opportunities along the way.

But for all of us, it’s critical that we are prepared for our journeys in the right vessel, keep our destinations in mind, stick with the plans, and have a trusted navigator to chart our courses and keep us on target.1

© 2018 S&P Dow Jones Indices LLC, a division of S&P Global. All rights reserved. Not representative of an actual investment. Indices are not available for direct investment; therefore, their performance does not reflect the expenses associated with the management of an actual portfolio.

Stormy Weather

Headlines from the “lost decade”2 can help illustrate several periods when markets were volatile.

May 1999: Dow Jones Industrial Average Closes Above 11,000 for the First Time

March 2000: Nasdaq Stock Exchange Index Reaches an All-Time High of 5,048

April 2000: In Less Than a Month, Nearly a Trillion Dollars of Stock Value Evaporates

October 2002: Nasdaq Hits a Bear-Market Low of 1,114

September 2005: Home Prices Post Record Gains

September 2008: Lehman Files for Bankruptcy, Merrill Is Sold

Staying the Course

While these events are now a decade or more behind us, they can still serve as an important reminder for investors today. For many, feelings of elation or despair can accompany headlines like these. We should remember that markets can be volatile and recognize that, in the moment, doing nothing may feel paralyzing. Throughout these ups and downs, however, if one had hypothetically invested $10,000 in U.S. stocks in May 1999 and stayed invested, that investment would be worth approximately $28,000 today.3

[1] Source: Dimensional Fund Advisors, LP. Adapted from “Sailing with the Tides,” Outside the Lines by Jim Parker, March 2018.

[2] For the U.S. stock market, this is generally understood as the period inclusive of 1999-2009

[3] As measured by the S&P 500 Index. A hypothetical portfolio of $10,000 invested on April 30, 1999, and tracking the S&P 500 Index, would have grown to $28,408 on March 31, 2018. However, performance of a hypothetical investment does not reflect transaction costs, taxes, or returns that any investor actually attained and may not reflect the true costs, including management fees, of an actual portfolio. Changes in any assumptions may have a material impact on the hypothetical returns presented. It is not possible to invest directly in an index.


Past performance does not guarantee future results. All investments include risk and have the potential for loss as well as gain.

Data sources for returns and standard statistical data are provided by the sources referenced and are based on data obtained from recognized statistical services or other sources we believe to be reliable. However, some or all information has not been verified prior to the analysis, and we do not make any representations as to its accuracy or completeness. Any analysis nonfactual in nature constitutes only current opinions, which are subject to change. Benchmarks or indices are included for information  purposes  only  to  reflect  the  current  market  environment;  no  index  is  a directly  tradable  investment.  There  may  be  instances  when  consultant  opinions  regarding any fundamental or quantitative analysis do not agree.

The  commentary  contained  herein  has  been  compiled  by  W.  Reid  Culp,  III  from  sources  provided  by  TAGStone  Capital,  Capital  Directions,  DFA,  Vanguard,  Morningstar,  as  well  as  commentary  provided  by  Mr.  Culp,  personally,  and  information  independently  obtained  by  Mr.  Culp.  The  pronoun  “we,”  as  used  herein,  references collectively the sources noted above.

TAGStone Capital, Inc. provides this update to convey general information about market conditions and not for the purpose of providing investment advice. Investment in any of the companies or sectors mentioned herein may not be appropriate for you. You should consult your advisor from TAGStone for investment advice regarding your own situation.


Recent Market Correction

After a period of relative calm in the markets, in recent days the increase in volatility in the stock market has resulted in renewed anxiety for many investors.

From January 27 to February 8, the U.S. market (as measured by the S&P 500 Index) fell more than 10%, marking the first stock market correction in more than two years. A stock market correction is defined as a 10% decline from the previous high. The last correction was in January 2016, when the market fell 11% in the worst start to any year on record. The recent correction has left many investors wondering what the future holds and if they should make changes to their portfolios.

While it may be difficult to remain calm during a substantial market decline, it is important to remember that volatility is a normal part of investing. Additionally, for long-term investors, reacting emotionally to volatile markets may be more detrimental to portfolio performance than the drawdown itself.

Intra-Year Declines

Exhibit 1 shows calendar year returns for the U.S. stock market since 1980, as well as the largest intra-year declines that occurred during each year. During this period, the average intra-year decline was about 14%. About half of the years observed had declines of more than 10%, and around a third had declines of more than 15%. Despite substantial intra-year drops, calendar year returns were positive in 29 years out of the 39 examined. This shows just how common market declines are and how difficult it is to say whether a large intra-year decline will result in negative returns over the entire year.1

Reacting Impacts Performance

If one was to try and time the market in order to avoid the potential losses associated with periods of increased volatility, would this help or hinder long-term performance? If current market prices aggregate the information and expectations of market participants, it should be difficult, if not impossible, to profitably time the market. In other words, it is unlikely that investors can successfully time the market, and if they do manage it, it may be a result of luck rather than skill.

It is also important to keep in mind that market timing generally involves both a buy and a sell decision. For example, if an investor believes the market is too high, the investor would need to decide when to sell. At a later point in time, the investor would need to make a decision when to buy back in. While it’s difficult to make a properly timed sell decision, it’s even more difficult to combine a properly timed sell decision with a properly timed buy decision.

When trying to time a market correction, it’s helpful to keep in mind a quote from the legendary Wall Street investor, Peter Lynch:

"Far more money has been lost by investors preparing for corrections, or trying to anticipate corrections than has been lost in corrections themselves.”[2]

And We’re Only Talking a Few Days

Further complicating the prospect of market timing being additive to portfolio performance is the fact that a substantial proportion of the total return of stocks over long periods comes from just a handful of days. The inability of investors to be able to predict which days will have strong returns and which will not is another reason for investors to remain invested during periods of volatility rather than jump in and out of stocks. Otherwise, an investor runs the risk of being on the sidelines on days when returns happen to be strongly positive.

Exhibit 2 helps illustrate this point. It shows the annualized compound return of the S&P 500 Index going back to 1990 and illustrates the impact of missing out on just a few days of strong returns. The bars represent the hypothetical growth of $1,000 over the period and show what happened if you missed the best single day during the period and what happened if you missed a handful of the best single days. The data shows that being on the sidelines for only a few of the best single days in the market would have resulted in substantially lower returns than the total period had to offer.3

Asset Allocation Decision

The foundation of an investor’s investment plan should be a pre-determined ratio between stocks and bonds, also called an asset allocation. In general, the higher the ratio of stocks to bonds in an investor’s portfolio, the riskier the portfolio is considered to be since stocks generally have a greater risk of loss than bonds. The ratio should be set at a level that the investor can stick with through market ups and downs, based on their ability and willingness to take risk. The biggest risk that most individual investors face is the risk that they will sell out of their stocks at the bottom of a market cycle.

An investor’s hypothetical financial ability to bear a financial loss is easy to measure because it can be reduced to a mathematical conclusion based on the investor’s financial assets and time until they need the money. However, an investor’s “stomach” for volatility is more difficult to measure because most people don’t know how they will react when they see a significant drop in the price of stocks of 20%, 25%, or 30%. When times are good, like now, people become overconfident and many investors will overstate their willingness to withstand volatility.

Since there is a subjective nature to determining an investor’s ratio between stocks and bonds, two rules of thumbs may help:

Asset Allocation Decision (Continued)

1. When looking across the spectrum of all individual investors, the most common ratio is about 60% stocks and 40% bonds.

2. Younger investors are able to assume more risk since they have a longer time to make up a market downturn. So, one way to determine your ratio is to take 110 minus your age equals how much you should have in stocks (For example, 110 – 45 years old = 65% allocation to stocks).

Finally, Benjamin Graham, the great teacher of Warren Buffett, advocates in his book The Intelligent Investor (probably the most-respected investment book ever written) using a 50/50 stock/bond ratio as a baseline, and shifting as far as 25/75 in either direction, based upon current market conditions. Graham explains it this way:

"The sound reason for increasing the percentage in common stocks [beyond 50%] would be the appearance of ‘bargain price’ levels created in a protracted bear market. Conversely, sound procedure would call for reducing the common-stock component below 50% when in the judgment of the investor the market level has become dangerously high."

Systematic Rebalancing Helps

While the evidence has shown that it is difficult to use market timing to produce superior results, systematically rebalancing a portfolio is an important aspect of TAGStone’s investment process. Systematic rebalancing is designed to sell certain assets that have gone up above their target level and purchase certain assets that have gone down below their target level.

TAGStone is able to rebalance your portfolio periodically between stocks and bonds. If you have selected a 60/40 ratio, then 60% of your portfolio is allocated to stocks and 40% is allocated to bonds. If stocks go up, and your allocation to stocks goes to 75% of your portfolio for example, then TAGStone has the ability, after discussing with you, to sell a portion of your stocks that have increased in value and redeploy the proceeds into bonds.

In addition, some of the fund managers utilized by TAGStone periodically rebalance within the funds that they manage. This means, in general, they are selling stocks that have gone up in value and buying stocks at lower valuations based on predetermined market metrics.

For many investors, now is a relevant time to carefully consider rebalancing. The surge in stock prices over the last fourteen months has pushed up the stock allocation for many investors above their long-term target level. While it’s not pleasant to sell stocks when they are on an upward trend, momentum is a difficult factor to trade and trends can reverse at any point without a clear reason.

Staying Disciplined

With the recent volatility, investors may be asking themselves: “Is now a good time for me to revisit a change in my asset allocation?” An appropriate answer is highly dependent upon an investor’s unique situation and their risk and return objectives. For investors considering a change to their asset allocation, a disciplined approach with a long-term view is likely more prudent than making a decision based on a reaction to short-term market movements.

While market volatility can be nerve-racking for investors, reacting emotionally and changing long-term investment strategies in response to short-term declines could prove more harmful than helpful. By adhering to a well-thought-out investment plan, ideally agreed upon in advance of periods of volatility, investors may be better able to remain calm during periods of short-term uncertainty.

Over the long term, the financial markets have rewarded investors. People expect a positive return on the capital they supply, and historically, the equity and bond markets have provided meaningful growth of wealth. As investors prepare for 2018 and what the year may bring, we should remember that frequent changes to an investment strategy can hurt performance. Rather than trying to time the market based on hunches, headlines, or indicators, investors, who pick and stay disciplined to an asset allocation, should benefit from expected long-term positive market returns.

1. Source: Dimensional Fund Advisors, LP

2. https://www.cbsnews.com/news/the-smartest-things-ever-said-about-market-timing

3. Source: Dimensional Fund Advisors, LP


Past performance does not guarantee future results. All investments include risk and have the potential for loss as well as gain.

Data sources for returns and standard statistical data are provided by the sources referenced and are based on data obtained from recognized statistical services or other sources we believe to be reliable. However, some or all information has not been verified prior to the analysis, and we do not make any representations as to its accuracy or completeness. Any analysis nonfactual in nature constitutes only current opinions, which are subject to change. Benchmarks or indices are included for information  purposes  only  to  reflect  the  current  market  environment;  no  index  is  a directly  tradable  investment.  There  may  be  instances  when  consultant  opinions  regarding any fundamental or quantitative analysis do not agree.

The  commentary  contained  herein  has  been  compiled  by  W.  Reid  Culp,  III  from  sources  provided  by  TAGStone  Capital,  Capital  Directions,  DFA,  Vanguard,  Morningstar,  as  well  as  commentary  provided  by  Mr.  Culp,  personally,  and  information  independently  obtained  by  Mr.  Culp.  The  pronoun  “we,”  as  used  herein,  references collectively the sources noted above.

TAGStone Capital, Inc. provides this update to convey general information about market conditions and not for the purpose of providing investment advice. Investment in any of the companies or sectors mentioned herein may not be appropriate for you. You should consult your advisor from TAGStone for investment advice regarding your own situation.


Key Questions for the Long-Term Investor

Focusing on what you can control can lead to a better investment experience.

Whether you’ve been investing for decades or are just getting started, at some point on your investment journey you’ll likely ask yourself some of the questions below. Trying to answer these questions may be intimidating, but know that you’re not alone. TAGStone Capital is here to help. While this is not intended to be an exhaustive list it will hopefully shed light on a few key principles, using data and reasoning, that may help improve investors’ odds of investment success in the long run.

1.    What sort of competition do I face as an investor?

The market is an effective information-processing machine. Millions of market participants buy and sell securities every day and the real-time information they bring helps set prices.

This means competition is stiff and trying to outguess market prices is difficult for anyone, even professional money managers (see question 2 for more on this). This is good news for investors though. Rather than basing an investment strategy on trying to find securities that are priced “incorrectly,” investors can instead rely on the information in market prices to help build their portfolios (see question 5 for more on this).

Source: World Federation of Exchanges members, affiliates, correspondents, and non-members. Trade data from the global electronic order book. Daily averages were computed using year-to-date totals as of December 31, 2016, divided by 250 as an approximate number of annual trading days.


2.     What are my chances of picking an investment fund that survives and outperforms?

Flip a coin and your odds of getting heads or tails are 50/50. Historically, the odds of selecting an investment fund that was still around 15 years later are about the same. Regarding outperformance, the odds are worse. The market’s pricing power works against fund managers who try to outperform through stock picking or market timing. One needn’t look further than real-world results to see this. Based on research*, only 17% of US equity mutual funds and 18% of fixed income funds have survived and outperformed their benchmarks over the past 15 years.

Source: *Mutual Fund Landscape 2017, Dimensional Fund Advisors. See Appendix for important details on the study. Past performance is no guarantee of future results.


3.     If I choose a fund because of strong past performance, does that mean it will do well in the future?

Some investors select mutual funds based on past returns. However, research shows that most funds in the top quartile (25%) of previous five-year returns did not maintain a top-quartile ranking in the following year. In other words, past performance offers little insight into a fund’s future returns.

Source: *Mutual Fund Landscape 2017, Dimensional Fund Advisors. See Appendix for important details on the study. Past performance is no guarantee of future results.


4.     Do I have to outsmart the market to be a successful investor?

Financial markets have rewarded long-term investors. People expect a positive return on the capital they invest, and historically, the equity and bond markets have provided growth of wealth that has more than offset inflation. Instead of fighting markets, let them work for you.

US Small Cap is the CRSP 6–10 Index. US Large Cap is the S&P 500 Index. Long-Term Government Bonds is the IA SBBI US LT Govt TR USD, provided by Ibbotson Associates via Morningstar Direct. Treasury Bills is the IA SBBI US 30 Day TBill TR USD, provided by Ibbotson Associates via Morningstar Direct. US Inflation is measured as changes in the US Consumer Price Index. US Consumer Price Index data is provided by the US Department of Labor Bureau of Labor Statistics. CRSP data is provided by the Center for Research in Security Prices, University of Chicago. The S&P data is provided by Standard & Poor’s Index Services Group. Indices are not available for direct investment. Index performance does not reflect the expenses associated with the management of an actual portfolio. Past performance is no guarantee of future results.


5.    Is there a better way to build a portfolio?

Academic research has identified these equity and fixed income dimensions, which point to differences in expected returns among securities. Instead of attempting to outguess market prices, investors can instead pursue higher expected returns by structuring their portfolio around these dimensions.

Relative price is measured by the price-to-book ratio; value stocks are those with lower price-to-book ratios. Profitability is a measure of current profitability based on information from individual companies’ income statements.


6.     Is international investing for me?

Diversification helps reduce risks that have no expected return, but diversifying only within your home market may not be enough. Instead, global diversification can broaden your investment opportunity set. By holding a globally diversified portfolio, investors are well positioned to seek returns wherever they occur.

Number of holdings and countries for the S&P 500 Index and MSCI ACWI (All Country World Index) Investable Market Index (IMI) as of December 31, 2016. The S&P data is provided by Standard & Poor’s Index Services Group. MSCI data ©MSCI 2017, all rights reserved. International investing involves special risks such as currency fluctuation and political stability. Investing in emerging markets may accentuate those risks. Diversification does not eliminate the risk of market loss. Indices are not available for direct investment


7.     Will making frequent changes to my portfolio help me achieve investment success?

It’s tough, if not impossible, to know which market segments will outperform from period to period.

Accordingly, it’s better to avoid market timing calls and other unnecessary changes that can be costly. Allowing emotions or opinions about short-term market conditions to impact long-term investment decisions can lead to disappointing results.

US Large Cap is the S&P 500 Index. US Large Cap Value is the Russell 1000 Value Index. US Small Cap is the Russell 2000 Index. US Small Cap Value is the Russell 2000 Value Index. US Real Estate is the Dow Jones US Select REIT Index. International Large Cap Value is the MSCI World ex USA Value Index (net dividends). International Small Cap Value is the MSCI World ex USA Small Cap Value Index (net dividends). Emerging Markets is the MSCI Emerging Markets Index (net dividends). Five-Year US Government Fixed is the Bloomberg Barclays US TIPS Index 1–5 Years. The S&P data is provided by Standard & Poor’s Index Services Group. Frank Russell Company is the source and owner of the trademarks, service marks, and copyrights related to the Russell Indexes. Dow Jones data provided by Dow Jones Indices. MSCI data ©MSCI 2017, all rights reserved. Bloomberg Barclays data provided by Bloomberg. Indices are not available for direct investment. Index performance does not reflect the expenses associated with the management of an actual portfolio. Past performance is no guarantee of future results.


8.     Should I make changes to my portfolio based on what I’m hearing in the news?

Daily market news and commentary can challenge your investment discipline. Some messages stir anxiety about the future, while others tempt you to chase the latest investment fad. If headlines are unsettling, consider the source and try to maintain a long-term perspective.


9.     So, what should I be doing?

Work closely with a financial advisor who can offer expertise and guidance to help you focus on actions that add value. Focusing on what you can control can lead to a better investment experience.

  • Create an investment plan to fit your needs and risk tolerance.
  • Structure a portfolio along the dimensions of expected returns.
  • Diversify globally.
  • Manage fund expense ratios, turnover, and taxes.
  • Stay disciplined through market dips and swings.

Past performance does not guarantee future results. All investments include risk and have the potential for loss as well as gain.

Data sources for returns and standard statistical data are provided by the sources referenced and are based on data obtained from recognized statistical services or other sources we believe to be reliable. However, some or all information has not been verified prior to the analysis, and we do not make any representations as to its accuracy or completeness. Any analysis nonfactual in nature constitutes only current opinions, which are subject to change. Benchmarks or indices are included for information  purposes  only  to  reflect  the  current  market  environment;  no  index  is  a directly  tradable  investment.  There  may  be  instances  when  consultant  opinions  regarding any fundamental or quantitative analysis do not agree.

The  commentary  contained  herein  has  been  compiled  by  W.  Reid  Culp,  III  from  sources  provided  by  TAGStone  Capital,  Capital  Directions,  DFA,  Vanguard,  Morningstar,  as  well  as  commentary  provided  by  Mr.  Culp,  personally,  and  information  independently  obtained  by  Mr.  Culp.  The  pronoun  “we,”  as  used  herein,  references collectively the sources noted above.

TAGStone Capital, Inc. provides this update to convey general information about market conditions and not for the purpose of providing investment advice. Investment in any of the companies or sectors mentioned herein may not be appropriate for you. You should consult your advisor from TAGStone for investment advice regarding your own situation.


Stock Investing at All-Time Highs

As stock markets, once again, continue to hit all-time highs, investors take this news not with celebration, but with trepidation.

Modern stock markets have been worrying investors with new highs since they were created several centuries ago. For example, in 1955, Benjamin Graham, the great teacher of Warren Buffett, was called before Congress to testify about the level of the stock market—and answer the question: “is the market too high.” At the time, the Dow was up 56% from September 1953 to March 1955 and had just returned to its 1929 peak. The Senate committee wanted to ensure abusive actions were not going to create another meltdown—or as the chairman put it, “a final orgy of buying.”

To give a sense of the discussion, below is an excerpt of the statement from Mr. Graham:

"The true measure of common stock values, of course, is not found by reference to price movement alone, but by price in relation to earnings, dividends, future prospects, and to a small extent, asset values.

The Dow Jones industrials are now at a lower ratio to their average earnings in the past than they were at their highs in 1929, 1937, and 1946…. It should be pointed out also that high-grade interest rates are now definitely lower than in previous bull markets except for 1946. Lower basic interest rates presumably justify a higher value for each dollar of dividends or earnings.

Such a figure, if reliable would have to be regarded as rather reassuring. It would indicate that the market in terms of value is no higher now than it was in early 1926, or in early 1936, or late 1946.
It is fair to say the market is not too high today if we really managed to lick the business cycle. Although such a development would involve a revolutionary break with the past, I am not prepared to deny its possibility.

In my view, the fundamental reason for the rise [in the market since September 1953] was the swing from doubt to confidence—from emphasis on the risks in common stocks to the emphasis on the opportunities in common stocks.

My studies have led to the conclusion that sentiment alone, not supported by any visible change in value, will produce a swing on the order of 100 to 250 or 100 to 300 in price.”

An interesting point to note is that the level of the stock market that the senators were so concerned with was the Dow reaching 381. As we know to-day, the Dow crossed 22,000 for the first time on August 2, 2017.

Five Thoughts on the Stock Market

In the context of today’s all-time market highs, Mr. Graham’s 1955 testimony brings several things to mind about the stock market:

1.  Maintain an Asset Allocation that Can Withstand a Market Downturn:

As Mr. Graham stated, the stock market moves in cycles. The common anxiety investors face when investing in a historically high market is the fear of buying at the top, just in time to catch a downturn. And, as you can see in the chart below, the average bear market return, from peak-to-trough has been ‑45%.

A major investment risk individuals encounter during these periods is the risk that the investor sells his or her stock positions during a downturn, turns “paper losses” into real losses, and misses the ensuing bull market. This is why we recommend that you maintain an allocation to stocks and bonds that you can stick with through a market downturn.

In addition, it is important to allocate stock investments across several asset classes, such as small foreign stocks, international and U.S. REIT stocks, and emerging markets stocks. This asset class diversification greatly reduces the risk of being concentrated in a single asset class (such as large U.S. stocks) that endures a decades-long downturn and increases the opportunity to invest in some asset classes that may have lower valuations and produce positive returns.

2.  Stock Prices Follow Investor Expectations in the Short Run:

As Mr. Graham concluded, investor sentiment alone can create large swings in the stock price regardless of any change in real economic value. At any given time, investors can become overly optimistic about stocks or overly pessimistic about stocks.

Mr. Graham’s student, Warren Buffett, might have said it best: “In the short run, the stock market is a voting machine; in the long run, it is a weighing machine.”


5 Thoughts on the Stock Market (continued)

3.  Stock Valuations, in the Long Run, are Related to Corporate Earnings and Cash Flows:

As Buffett’s quote states, stock valuations, in the long run, are related to corporate earnings and cash flows. 

At the present time, the S&P 500 is highly valued by most metrics, but as shown in the table below from Goldman Sachs, the free cash flow yield on the S&P 500 is about 4.2%, almost directly on par with its long-term average of 4.0%, showing that the S&P 500 is fairly valued from this measure. 

4.  When stocks go down, investors become less inclined to invest, not more inclined:

There is a misguided belief among many investors that they will happily jump back into the stock market once a significant downturn has occurred. “Once we get a 20% downturn, I’ll invest,” goes the thinking.

But during such downturns, fear has usually gripped the market and news headlines are obsessed with how far the market has fallen and how much farther it will go.

Instead of feeling encouraged that stocks are a good buy, investors usually become more cautious, fearing they will put money into stocks only to see the market continue to fall. Instead investors usually continue to sit on the sidelines, waiting until things “calm down.”

5.  Investing Near All-Time Highs is Part of Stock Investing:

Investing near all-time highs is part of stock investing. As shown in the graph to the right, the stock market, from January 1926 to December 2016, has closed at new month-end highs almost 30% of the time.

Historically, however, new highs have not been useful predictors of future returns. As the graph indicates, the chances of positive monthly returns over any 12-month period is about the same, whether the market is hitting a new high or not.

The Bottom Line

The bottom line is that making subjective decisions about when to invest in stocks is difficult. In a fully-valued market like today, investors should be prepared for a market downturn, even though a fully-valued market does not mean that a downturn is imminent. Instead, a market drawdown can occur at any time or any level of the market.

Instead of trying to time the market, TAGStone Capital recommends choosing a prudent investment strategy that you can stick with through any market conditions. Studies have shown that the average investor times the market poorly, getting in at the top and getting out at the bottom, and achieves below available returns.

When asked by the Senate chairman how he deals with market levels in his business, Mr. Graham responded insightfully:

"I have never specialized in economic forecasting or market forecasting either. My own business has been largely based on the principle that if you can make your results independent of any views as to the future you are that much better off.

I think our success is due to our having established sound principles of purchase and sale of securities and having followed them consistently through all kinds of markets."


Past performance does not guarantee future results. All investments include risk and have the potential for loss as well as gain.

Data sources for returns and standard statistical data are provided by the sources referenced and are based on data obtained from recognized statistical services or other sources we believe to be reliable. However, some or all information has not been verified prior to the analysis, and we do not make any representations as to its accuracy or completeness. Any analysis nonfactual in nature constitutes only current opinions, which are subject to change. Benchmarks or indices are included for information  purposes  only  to  reflect  the  current  market  environment;  no  index  is  a directly  tradable  investment.  There  may  be  instances  when  consultant  opinions  regarding any fundamental or quantitative analysis do not agree.

The  commentary  contained  herein  has  been  compiled  by  W.  Reid  Culp,  III  from  sources  provided  by  TAGStone  Capital,  Capital  Directions,  DFA,  Vanguard,  Morningstar,  as  well  as  commentary  provided  by  Mr.  Culp,  personally,  and  information  independently  obtained  by  Mr.  Culp.  The  pronoun  “we,”  as  used  herein,  references collectively the sources noted above.

TAGStone Capital, Inc. provides this update to convey general information about market conditions and not for the purpose of providing investment advice. Investment in any of the companies or sectors mentioned herein may not be appropriate for you. You should consult your advisor from TAGStone for investment advice regarding your own situation.


The Uncertainty Paradox

Doubt is not a pleasant condition, but certainty is an absurd one. —Voltaire

“The market hates uncertainty” has been a common enough saying in recent years, but how logical is it? There are many different aspects to uncertainty, some that can be measured and some that cannot. Uncertainty is an unchangeable condition of existence. As individuals, we can feel more or less uncertain, but that is a distinctly human phenomenon. Rather than ebbing and flowing with investor sentiment, uncertainty is an inherent and ever-present part of investing in markets. Any investment that has an expected return above the prevailing “risk-free rate” (think T-Bills for US investors) involves trading off certainty for a potentially increased return.

Consider this concept through the lens of stock vs. bond investments. Stocks have higher expected returns than bonds largely because there is more uncertainty about the future state of the world for equity investors than bond investors. Bonds, for the most part, have fixed coupon payments and a maturity date at which principal is expected to be repaid. Stocks have neither. Bonds also sit higher in a company’s capital structure. In the event a firm goes bust, bondholders get paid before stockholders. So, do investors avoid stocks in favor of bonds because of this increased uncertainty? Quite the contrary, many investors end up allocating capital to stocks due to their higher expected return. In the end, many investors are often willing to make the trade off of bearing some increased uncertainty for potentially higher returns.

Managing Emotions: While the statement “the market hates uncertainty” may not be totally logical, it doesn’t mean it lacks educational value. Thinking about what the statement is expressing allows us to gain insight into the mindset of individuals. The statement attempts to personify the market by ascribing the very real nervousness and fear felt by some investors when volatility increases. It is recognition of the fact that when markets go up and down, many investors struggle to separate their emotions from their investments. It ultimately tells us that for many an investor, regardless of whether markets are reaching new highs or declining, changes in market prices can be a source of anxiety. During these periods, it may not feel like a good time to invest. Only with the benefit of hindsight do we feel as if we know whether any time period was a good one to be invested. Unfortunately, while the past may be prologue, the future will forever remain uncertain.

Staying in Your Seat: In a recent interview, David Booth, the founder of Dimensional Fund Advisors, was asked about what it means to be a long-term investor:

“People often ask the question, ‘How long do I have to wait for an investment strategy to pay off? How long do I have to wait so I’m confident that stocks will have a higher return than money market funds, or have a positive return?’ And my answer is it’s at least one year longer than you’re willing to give. There is no magic number. Risk is always there.”

Part of being able to stay unemotional during periods when it feels like uncertainty has increased is having an appropriate asset allocation that is in line with an investor’s willingness and ability to bear risk. It also helps to remember that, during what feels like good times and bad, one wouldn’t expect to earn a higher return without taking on some form of risk. While a decline in markets may not feel good, having a portfolio you are comfortable with, understanding that uncertainty is part of investing, and sticking to a plan that is agreed upon in advance and reviewed on a regular basis can help keep investors from reacting emotionally. This may ultimately lead to a better investment experience.

Investment Shock Absorbers

Ever ridden in a car with worn-out shock absorbers? Every bump is jarring, every corner stomach-churning, and every red light an excuse to assume the brace position. Owning an undiversified portfolio can trigger similar reactions.[1]

Throw in the risk of a breakdown or running off the road altogether, and there’s a real chance you may not reach your destination. In the world of investment, a similarly bumpy and unpredictable ride can await those with concentrated and undiversified portfolios or those who constantly tinker with their allocation.

Of course, everyone feels in control when the surface is straight and smooth, but it’s harder to stay on the road during sudden turns and ups and downs in the market.

For that reason, the smart thing to do is to diversify, spreading your portfolio across different securities, sectors, and countries. That also means identifying the right mix of investments (e.g., stocks, bonds, real estate) that aligns with your risk tolerance.

Using this approach, your returns from year to year may not match the top performing portfolio, but neither are they likely to match the worst. More importantly, this is a ride you are likelier to stick with.

Here’s an example. Among developed markets, Denmark was number one in US dollar terms in 2015 with a return of more than 23%. But a big bet on that country the following year would have backfired, as Denmark slid to bottom of the table with a loss of nearly 16%.[2]

It’s true that the US stock market (by far the world’s biggest) has been a strong performer in recent years. But a decade before, in 2004 and 2006, it was the second worst-performing developed market in the world.

Predicting which part of a market will do best over a given period is tough. US small cap stocks were among the top performers in 2016 with a return of more than 21%. A year before, their results looked relatively disappointing with a loss of more than 4%. International small cap stocks had their turn in the sun in 2015, topping the performance tables with a return of just below 6%. But the year before that, they were the second worst with a loss of 5%. [3]

Investment Shock Absorbers (Continued)

If you’ve ever taken a long road trip, you’ll know that conditions along the way can change quickly and unpredictably, which is why you need a vehicle that’s ready for the worst roads as well as the best. While diversification can never completely eliminate the impact of bumps along your particular investment road, it does help reduce the potential outsized impact that any individual investment can have on your journey.

[1] Adapted from “Investment Shock Absorbers,” Outside the Flags, February 2017.

[2] In US dollars. MSCI developed markets country indices (net dividends).

[3] In US dollars. US Small Cap is the Russell 2000 Index. International Small Cap is the MSCI World ex USA Small Cap Index (gross dividends).

High Valuations Conundrum

Much research has been done on stock valuations, and historically buying into the market at lower valuations has seen higher returns than when buying in at higher valuations. However, the data is noisy. 

On the following chart, the green area represents the 10-year trailing price-to-earnings (P/E) ratio of the S&P 500, commonly referred to as the CAPE ratio. You can think of this as a gauge to see if the overall price of the stock market is expensive or cheap. As you can see, we’re currently at a fairly-elevated level, around 29 dollars of price for every dollar of earnings, though far below the peaks seen in 2000. [4]

It can be enticing to think it’s possible to time the market based on valuation ratios like these, but even the creator of this ratio, Professor Robert Shiller, cautions against using the ratio to make trades. And keep in mind you have to guess right not once, but twice — knowing when to get back into the market.

Take, for example, the last time the 10-year trailing P/E ratio of the S&P 500 broke through the current level was in February 1997. If you had sold out fearing high valuations at that time, you would have missed out on another three years of up markets, cumulating an additional 86% gain before seeing any meaningful decline.

At that point in February 1997, the S&P 500 was trading at 798; if you sold out waiting to buy back in once the market was lower, you would have had to wait twelve years, until March 2009. And if you missed that brief opportunity, you might still be waiting some 20 years later. Meanwhile, the S&P 500 is above 2,300.

Furthermore, it is important to note the level of interest rates over the last 20 years, as they are a major force on stock prices. A stock is generally valued by how much cash can be obtained from the company between now and judgment day, discounted by a benchmark rate. Many stock investors use the yield on the 10-year US Treasury bond as their benchmark rate, because it is assumed to be risk free and generally matches their investment time horizon.

In February 1997, the yield on the 10-year Treasury was 5.95%, and it has steadily declined since then, now standing at 2.38%, as of March 31, 2017. This might seem like a small change of only 3.57% (5.95% - 2.38% = 3.57%), but in percentage terms, it is a large 60% decrease (3.57% / 5.95% = 60%).

In the stock price equation, when the discount rate goes down, stock prices go up, and, at these levels, small changes in the discount rate can have a significant effect on an investor’s final valuation of a stock—this is just mathematics.

The difficulty arises in trying to predict the future scenario for interest rates. If an investor assumes these low levels of interest rates will continue for a long time, then stock prices look cheap, and they should buy, buy, buy. However, if an investor assumes interest rates will rise, then stocks start to look fully valued to expensive.

And both interest rate scenarios are a reality—for the low interest rate outcome just look to Japan over the last 30 years or the US in the 1940s, and for the high interest rate outcome look to the US in the 1980s.

Therefore, at TAGStone Capital, we recommend a balanced approach between stocks and bonds, with an appropriate rebalancing strategy, in case either scenario plays out. Instead of trying to predict what interest rates will be in three to ten years, we think a better strategy is to target dimensions of higher returns (size, value, and profitability) and stay the course when the market gets bumpy.

[4] Source: Robert Shiller Online Data library via Yale. CAPE tracks current S&P 500 price versus average of inflation-adjusted earnings over previous 10 years.


Past performance does not guarantee future results. All investments include risk and have the potential for loss as well as gain.

Data sources for returns and standard statistical data are provided by the sources referenced and are based on data obtained from recognized statistical services or other sources we believe to be reliable. However, some or all information has not been verified prior to the analysis, and we do not make any representations as to its accuracy or completeness. Any analysis nonfactual in nature constitutes only current opinions, which are subject to change. Benchmarks or indices are included for information  purposes  only  to  reflect  the  current  market  environment;  no  index  is  a directly  tradable  investment.  There  may  be  instances  when  consultant  opinions  regarding any fundamental or quantitative analysis do not agree.

The  commentary  contained  herein  has  been  compiled  by  W.  Reid  Culp,  III  from  sources  provided  by  TAGStone  Capital,  Capital  Directions,  DFA,  Vanguard,  Morningstar,  as  well  as  commentary  provided  by  Mr.  Culp,  personally,  and  information  independently  obtained  by  Mr.  Culp.  The  pronoun  “we,”  as  used  herein,  references collectively the sources noted above.

TAGStone Capital, Inc. provides this update to convey general information about market conditions and not for the purpose of providing investment advice. Investment in any of the companies or sectors mentioned herein may not be appropriate for you. You should consult your advisor from TAGStone for investment advice regarding your own situation.


The Power of Markets

In 1958, economist Leonard Read published an essay entitled “I, Pencil: My Family Tree as Told to Leonard E. Read.”1

The essay, narrated from the point of view of a pencil, describes the “complex combination of miracles” necessary to create and bring to market the commonplace writing tool that has been used for generations. The narrator argues that no single individual possesses enough ability or know-how to create a pencil on their own. Rather, the mundane pencil—and the ability to purchase it for a “trifling” sum—is the result of an extraordinary process driven by the knowledge of market participants and the power of market prices.

The Importance of Price

Upon observing a pencil, it is tempting to think a single individual could easily make one. After all, it is made up of common items such as wood, paint, graphite, metal, and a rubber eraser. By delving deeper into how these seemingly ordinary components are produced, however, we begin to understand the extraordinary backstory of their synthesis. Take the wood as an example: To produce wood requires a saw, to make the saw requires steel, to make steel requires iron. That iron must be mined, smelted, and shaped. A truck, train, or boat is needed to transport the wood from the forest to a factory where numerous machines convert it into lumber. The lumber is then transported to another factory where more machines assemble the pencil. Each of the components mentioned above and each step in the process have similarly complex backstories. All require materials that are sourced from far-flung locations, and countless processes are involved in refining them. While the multitude of inputs and processes necessary to create a pencil is impressive, even more impressive are the coordinated actions required by millions of people around the world to bring everything together. There is the direct involvement of farmers, loggers, miners, factory workers, and the providers of capital. There is also the indirect involvement of millions of others—the makers of rails, railroad cars, ships, and so on. Market prices are the unifying force that enables these millions of people to coordinate their actions efficiently.2

Workers with specific knowledge about their costs, constraints, and efforts use market prices to leverage the knowledge of others to decide how to direct their own resources and make a living. Consider the farmer, the logger, and the price of a tree. The farmer will have a deep understanding of the costs, constraints, and efforts required to grow trees. To increase profit, the farmer will seek out the highest price when selling trees to a logger. After purchasing the trees, the logger will convert them to wood and sell that wood to a factory. The logger understands the costs, constraints, and efforts required to do this, so to increase profit, the logger seeks to pay the lowest price possible when buying trees from the farmer. When the farmer and the logger agree to transact, the agreed upon price reflects their combined knowledge of the costs and constraints of both growing and harvesting trees. That knowledge allows them to decide how to efficiently allocate their resources in seeking a profit. Ultimately, it is price that enables this coordination. On a much larger scale, price formation is facilitated by competition between the many farmers that sell trees to loggers and between the many loggers that buy trees from farmers. This market price of trees is observable and can be used by others in the production chain (e.g., the lumber factory mentioned above) to inform how much they can expect to pay for wood and to plan how to allocate their resources accordingly.

The Power of Financial Markets

There is a corollary that can be drawn between this narrative about the market for goods and the financial markets. Generally, markets do a remarkable job of allocating resources, and financial markets allocate a specific resource: financial capital. Financial markets are also made up of millions of participants, and these participants voluntarily agree to buy and sell securities all over the world based upon their own needs and desires. Each day, millions of trades take place, and the vast collective knowledge of all of these participants is pooled together to set security prices. Exhibit 1 shows the staggering magnitude of participation in the world equity markets on an average day in 2015.3

Any individual trying to outguess the market is competing against the extraordinary collective wisdom of all of these buyers and sellers. Viewed through the lens of Read’s allegory, attempting to outguess the market is like trying to create a pencil from scratch rather than going to the store and reaping the fruits of others’ willingly supplied labor. In the end, trying to outguess the market is incredibly difficult and expensive. One doesn’t have to look far for data that supports this. Exhibit 2 shows that only 17% of US equity mutual funds have survived and outperformed their benchmarks over the past 15 years.4

The Rewards of Providing Capital

The beauty of Leonard Read’s story is that it provides a glimpse of the incredibly complex tapestry of markets and how prices are formed, what types of information they contain, and how they are used. The story makes it clear that no single individual possesses enough ability or know-how to create a pencil on their own but rather that the pencil’s miraculous production is the result of the collective input and effort of countless motivated human beings. In the end, the power of markets benefits all of us. The market allows us to exchange the time we require to earn money for a few milliseconds of each person’s time involved in making a pencil. For an investor, we believe the lesson here is that instead of fighting the market, one should pursue an investment strategy that efficiently and effectively harnesses the extraordinary collective power of market prices. That is, an investment strategy that uses market prices and the information they contain in its design and day-to-day management. In doing so, an investor has access to the rewards that financial markets make available to providers of capital.

The Election: A Vote for Small Cap Stocks?

In the days immediately following the recent US presidential election, US small company stocks experienced higher returns than US large company stocks. This example helps illustrate how the dimensions of expected returns can appear quickly, unpredictably, and with large magnitude.

Average returns for US small company stocks historically have been higher than the average returns for US large company stocks. But those returns include long periods of both strong and weak relative performance.

Investors may attempt to enhance returns by increasing their exposure to small company stocks at what appear to be the most opportune times. Yet this effort to time the size premium can be frustrating because the most rewarding results often occur in an unpredictable manner.

A recent paper5 by Wei Dai, PhD, explores the challenges of attempting to time the size, value, and profitability premiums.6

Here we will keep the discussion to a simpler example. As of October 31, 2016, small company stocks had outpaced large company stocks for the year-to-date by 0.34 percentage points.

To the surprise of many market observers, the broad stock market rose following the US presidential election on November 8, with small company stocks outperforming the market as a whole. In the eight trading days following the US presidential election, the small cap premium, as measured by the return difference between the Russell 2000 and Russell 1000, was 7.8 percentage points. This helped small company stocks pull ahead of large company stocks year-to-date, as of November 30, by approximately 8 percentage points and for a full one-year period by approximately 4 percentage points.

This recent example highlights the importance of staying disciplined. The premiums associated with the size, value, and profitability dimensions of expected returns may show up quickly and with large magnitude. There is no guarantee that the size premium will be positive over any period, but investors put the odds of achieving augmented returns in their favor by maintaining constant exposure to the dimensions of higher expected returns.

Riding the Wave

As the Dow Jones Industrial Average attempts to cross the 20,000 point mark and other stock market indices hit all-time highs, some investors might fear the market is “overvalued” or “too high.” While savvy investors know that market corrections occur and that they can occur fast, furiously, and unexpectedly, they also know that it’s hard to time a correction, because you must be right two times. First, in getting out of the market, and second, in getting back in.

On trying to predict corrections, the great stock investor, Peter Lynch, said, "Far more money has been lost by investors preparing for corrections, or trying to anticipate corrections, than has been lost in corrections themselves."

We saw this firsthand recently with those investors who moved to cash before the election and ultimately missed out on the post-election rally. It’s important to remember that stocks are forward-looking and typically “price in” anticipated news ahead of time. Moreover, when news changes, stocks incorporate this news into their prices quickly and before most investors can react.

Peter Lynch summarizes the difficulty of market timing by saying, "I can't recall ever once having seen the name of a market timer on Forbes' annual list of the richest people in the world. If it were truly possible to predict corrections, you'd think somebody would have made billions by doing it."

At TAGStone Capital, we think it is a tall task to say that the whole market is wrong or overpriced, because the market may be making rational assumptions about growth or discount rates, even if these assumptions are different from historical averages. Instead of trying to predict the value of the overall market, we think a better strategy is to target dimensions of higher returns (size, value, and profitability), which can present themselves at any time.

Furthermore, if a rational investor believes the market is being irrational—a state in which it can remain for some time—his optimal decision may be to partly ride the wave of optimism—given a predetermined stock/bond ratio and an appropriate rebalancing strategy.

[1] Leonard Read’s essay can be found here: http://econlib.org/library/Essays/rdPncl1.html.

[2] Source: Dimensional Fund Advisors LP, December 2016.

[3] US-domiciled mutual fund data is from the CRSP Survivor-Bias-Free US Mutual Fund Database, provided by the Center for Research in Security Prices, University of Chicago. Certain types of equity funds were excluded from the performance study. Index funds, sector funds, and funds with a narrow investment focus, such as real estate and gold, were excluded.

[4] Funds are identified using Lipper fund classification codes. Correlation coefficients are computed for each fund with respect to diversified benchmark indices using all return data available between January 1, 2001, and December 31, 2015. The index most highly correlated with a fund is assigned as its benchmark. Winner funds are those whose cumulative return over the period exceeded that of their respective benchmark. Loser funds are funds that did not survive the period or whose cumulative return did not exceed their respective benchmark.

[5] Wei Dai, “Premium Timing with Valuation Ratios” (white paper, Dimensional Fund Advisors, September 2016).

[6] Size premium: the return difference between small capitalization stocks and large capitalization stocks. Value premium: the return difference between stocks with low relative prices (value) and stocks with high relative prices (growth). Profitability premium: The return difference between stocks of companies with high profitability over those with low profitability.


Past performance does not guarantee future results. All investments include risk and have the potential for loss as well as gain.

Data sources for returns and standard statistical data are provided by the sources referenced and are based on data obtained from recognized statistical services or other sources we believe to be reliable. However, some or all information has not been verified prior to the analysis, and we do not make any representations as to its accuracy or completeness. Any analysis nonfactual in nature constitutes only current opinions, which are subject to change. Benchmarks or indices are included for information  purposes  only  to  reflect  the  current  market  environment;  no  index  is  a directly  tradable  investment.  There  may  be  instances  when  consultant  opinions  regarding any fundamental or quantitative analysis do not agree.

The  commentary  contained  herein  has  been  compiled  by  W.  Reid  Culp,  III  from  sources  provided  by  TAGStone  Capital,  Capital  Directions,  DFA,  Vanguard,  Morningstar,  as  well  as  commentary  provided  by  Mr.  Culp,  personally,  and  information  independently  obtained  by  Mr.  Culp.  The  pronoun  “we,”  as  used  herein,  references collectively the sources noted above.

TAGStone Capital, Inc. provides this update to convey general information about market conditions and not for the purpose of providing investment advice. Investment in any of the companies or sectors mentioned herein may not be appropriate for you. You should consult your advisor from TAGStone for investment advice regarding your own situation.


Presidential Elections and the Stock Market

Next month, Americans will head to the polls to elect the next president of the United States.

While the outcome is unknown, one thing is for certain: There will be a steady stream of opinions from pundits and prognosticators about how the election will impact the stock market. As we explain below, investors would be well‑served to avoid the temptation to make significant changes to a long‑term investment plan based upon these sorts of predictions.

Election Expectations Baked into Stock Prices

Trying to outguess the market is normally a losing game. Current market prices offer an up-to-the-minute snapshot of the aggregate expectations of market participants. This includes expectations about the outcome and impact of elections. While unanticipated future events—surprises relative to those expectations—may trigger price changes in the future, the nature of these surprises cannot be known by investors today. As a result, it is difficult, if not impossible, to systematically benefit from trying to identify mispriced securities. This suggests it is unlikely that investors can gain an edge by attempting to predict what will happen to the stock market after a presidential election.

Returns During and After Election Years

On average, market returns have been positive in both election years and the year subsequent to elections. The chart below shows average annual returns of the S&P 500 during an election year and the year subsequent to an election from 1928 to 2013. Over these periods, the S&P 500 returned 11.2% and 9.3%, respectively.

The chart illustrates that the annual returns surrounding an election are similar to the long-term returns of the S&P 500. This suggests that market expectations associated with election outcomes are embedded in security prices.

This can also be seen with the volatility and uncertainty that occurs when election outcomes are different from market expectations, as seen early this year with the Brexit vote. Leading up to the vote, the market predicted a “no” vote, but reacted strongly when the citizens of the United Kingdom voted in favor of leaving the European Union.

If the candidate or party trailing in the polls wins unexpectedly, the market must reprice the outcome, which results in volatility.

A similar risk story can be applied to the lower average returns following an election year. Some argue that the uncertainty surrounding a new administration’s policies leads to this result.

Short-term Trading and Presidential Election Results

Exhibit 1 shows the frequency of monthly returns (expressed in 1% increments) for the S&P 500 Index from January 1926 to June 2016. Each horizontal dash represents one month, and each vertical bar shows the cumulative number of months for which returns were within a given 1% range (e.g., the tallest bar shows all months where returns were between 1% and 2%). The blue and red horizontal lines represent months during which a presidential election was held. Red corresponds with a resulting win for the Republican Party and blue with a win for the Democratic Party. This graphic illustrates that election month returns were well within the typical range of returns, regardless of which party won the election.

Long-Term Investing: Bulls & Bears ≠ Donkeys & Elephants

Predictions about presidential elections and the stock market often focus on which party or candidate will be “better for the market” over the long run. Exhibit 2 shows the growth of one dollar invested in the S&P 500 Index over nine decades and 15 presidencies (from Coolidge to Obama). This data does not suggest an obvious pattern of long-term stock market performance based upon which party holds the Oval Office. The key takeaway here is that over the long run, the market has provided substantial returns regardless of who controlled the executive branch.

Vote for the Long Term

Equity markets can help investors grow their assets, but investing is a long-term endeavor. Trying to make investment decisions based upon the outcome of presidential elections is unlikely to result in reliable excess returns for investors.

At best, any positive outcome based on such a strategy will likely be the result of random luck. At worst, it can lead to costly mistakes. Accordingly, there is a strong case for investors to rely on patience and portfolio structure, rather than trying to outguess the market, in order to pursue investment returns.1

TAGStone remains committed to helping its clients have a good investment experience through this tumultuous election cycle. Its investment strategy is designed to capture factors of higher return that can present themselves at any time, including during this uncertain time. This is why, with your investment portfolio, we ask you to vote for the long term.

[1] Source: Dimensional Fund Advisors LP, October 2016.


Past performance does not guarantee future results. All investments include risk and have the potential for loss as well as gain.

Data sources for returns and standard statistical data are provided by the sources referenced and are based on data obtained from recognized statistical services or other sources we believe to be reliable. However, some or all information has not been verified prior to the analysis, and we do not make any representations as to its accuracy or completeness. Any analysis nonfactual in nature constitutes only current opinions, which are subject to change. Benchmarks or indices are included for information  purposes  only  to  reflect  the  current  market  environment;  no  index  is  a directly  tradable  investment.  There  may  be  instances  when  consultant  opinions  regarding any fundamental or quantitative analysis do not agree.

The  commentary  contained  herein  has  been  compiled  by  W.  Reid  Culp,  III  from  sources  provided  by  TAGStone  Capital,  Capital  Directions,  DFA,  Vanguard,  Morningstar,  as  well  as  commentary  provided  by  Mr.  Culp,  personally,  and  information  independently  obtained  by  Mr.  Culp.  The  pronoun  “we,”  as  used  herein,  references collectively the sources noted above.

TAGStone Capital, Inc. provides this update to convey general information about market conditions and not for the purpose of providing investment advice. Investment in any of the companies or sectors mentioned herein may not be appropriate for you. You should consult your advisor from TAGStone for investment advice regarding your own situation.