Key Questions for the Long-Term Investor – Third Quarter 2017

Key Questions for the Long-Term Investor

Focusing on what you can control can lead to a better investment experience.

Whether you’ve been investing for decades or are just getting started, at some point on your investment journey you’ll likely ask yourself some of the questions below. Trying to answer these questions may be intimidating, but know that you’re not alone. TAGStone Capital is here to help. While this is not intended to be an exhaustive list it will hopefully shed light on a few key principles, using data and reasoning, that may help improve investors’ odds of investment success in the long run.

1.    What sort of competition do I face as an investor?

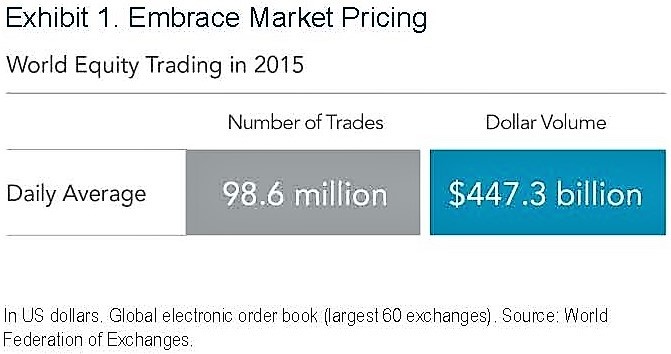
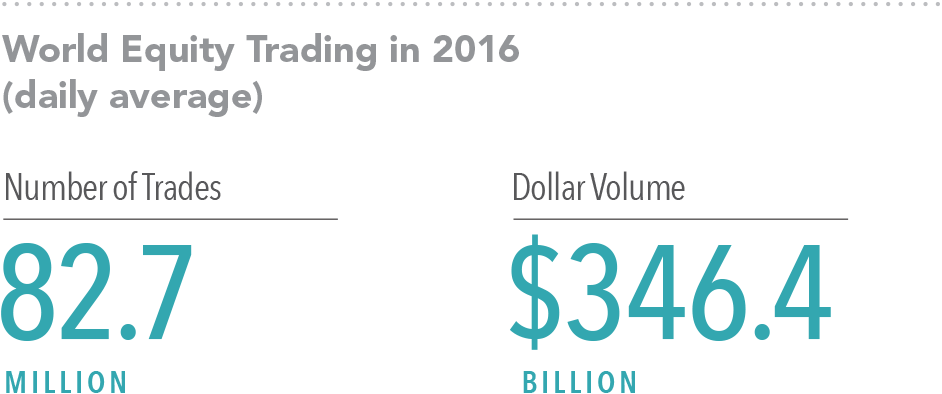
The market is an effective information-processing machine. Millions of market participants buy and sell securities every day and the real-time information they bring helps set prices.

This means competition is stiff and trying to outguess market prices is difficult for anyone, even professional money managers (see question 2 for more on this). This is good news for investors though. Rather than basing an investment strategy on trying to find securities that are priced “incorrectly,” investors can instead rely on the information in market prices to help build their portfolios (see question 5 for more on this).

Source: World Federation of Exchanges members, affiliates, correspondents, and non-members. Trade data from the global electronic order book. Daily averages were computed using year-to-date totals as of December 31, 2016, divided by 250 as an approximate number of annual trading days.


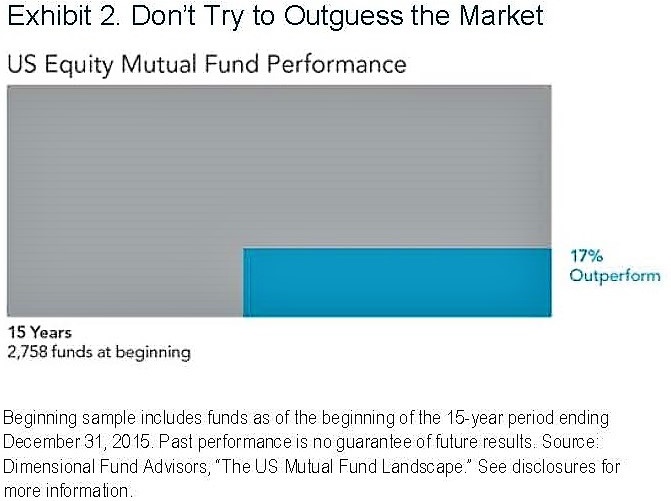
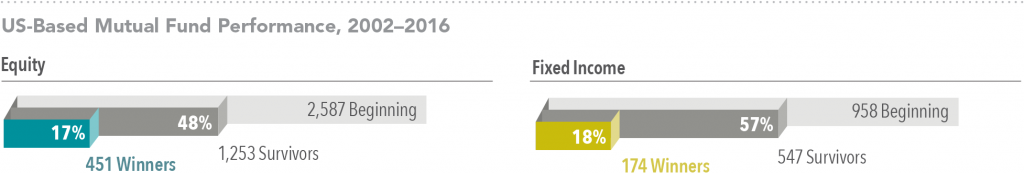
2.     What are my chances of picking an investment fund that survives and outperforms?

Flip a coin and your odds of getting heads or tails are 50/50. Historically, the odds of selecting an investment fund that was still around 15 years later are about the same. Regarding outperformance, the odds are worse. The market’s pricing power works against fund managers who try to outperform through stock picking or market timing. One needn’t look further than real-world results to see this. Based on research*, only 17% of US equity mutual funds and 18% of fixed income funds have survived and outperformed their benchmarks over the past 15 years.

Source: *Mutual Fund Landscape 2017, Dimensional Fund Advisors. See Appendix for important details on the study. Past performance is no guarantee of future results.


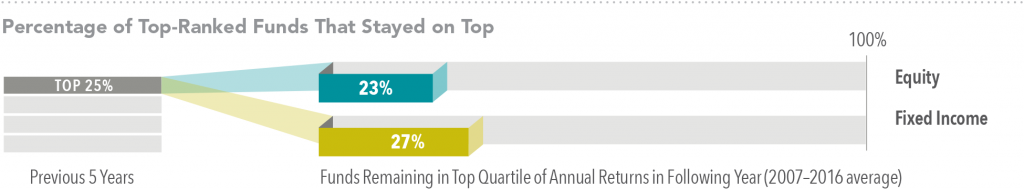
3.     If I choose a fund because of strong past performance, does that mean it will do well in the future?

Some investors select mutual funds based on past returns. However, research shows that most funds in the top quartile (25%) of previous five-year returns did not maintain a top-quartile ranking in the following year. In other words, past performance offers little insight into a fund’s future returns.

Source: *Mutual Fund Landscape 2017, Dimensional Fund Advisors. See Appendix for important details on the study. Past performance is no guarantee of future results.


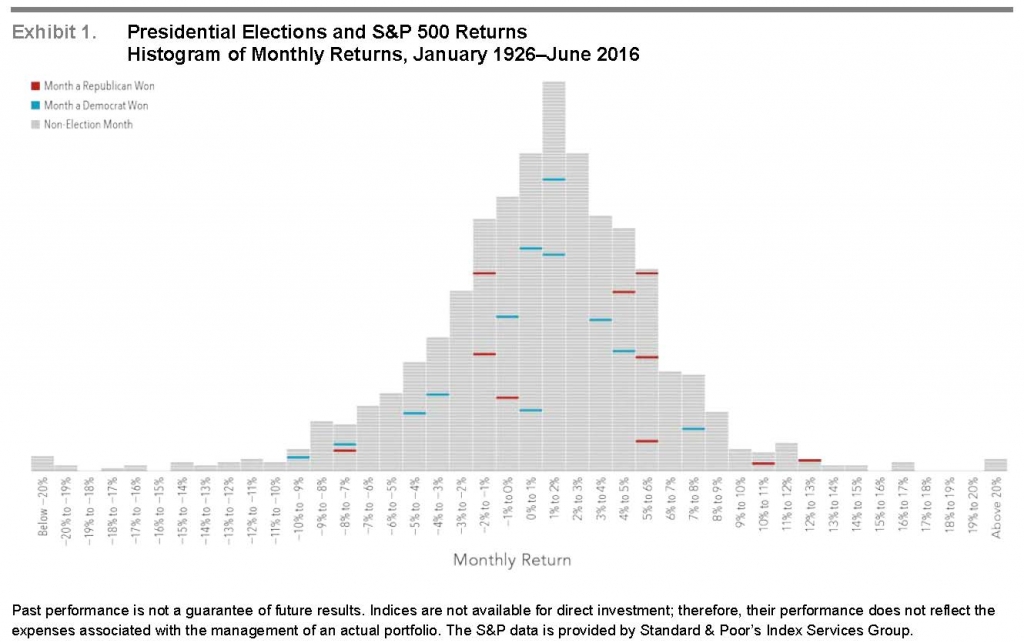
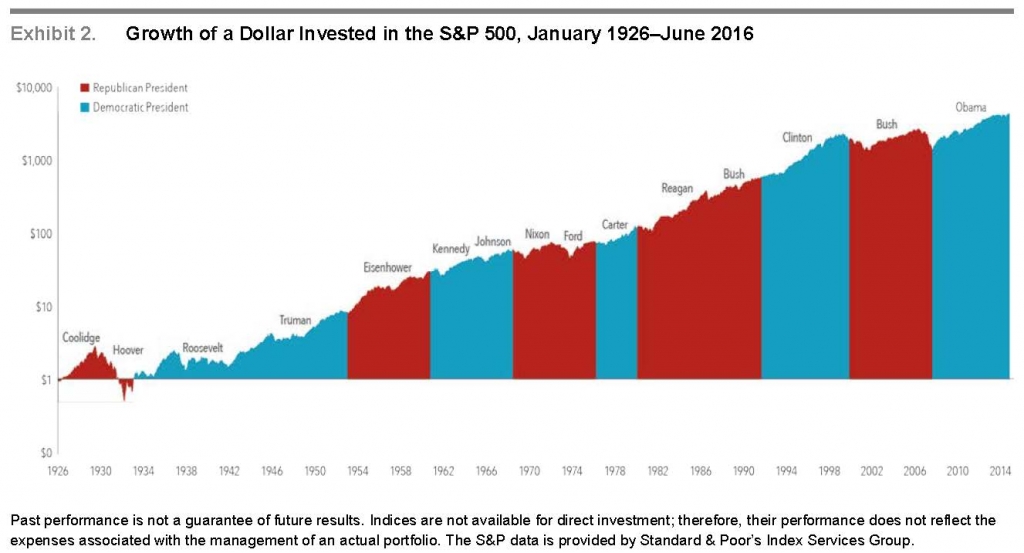
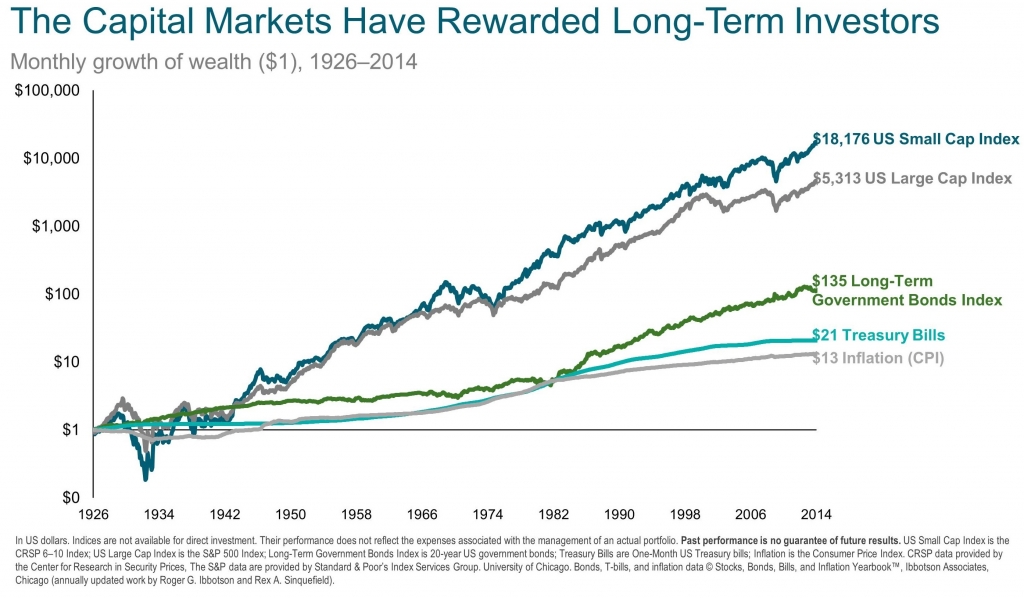
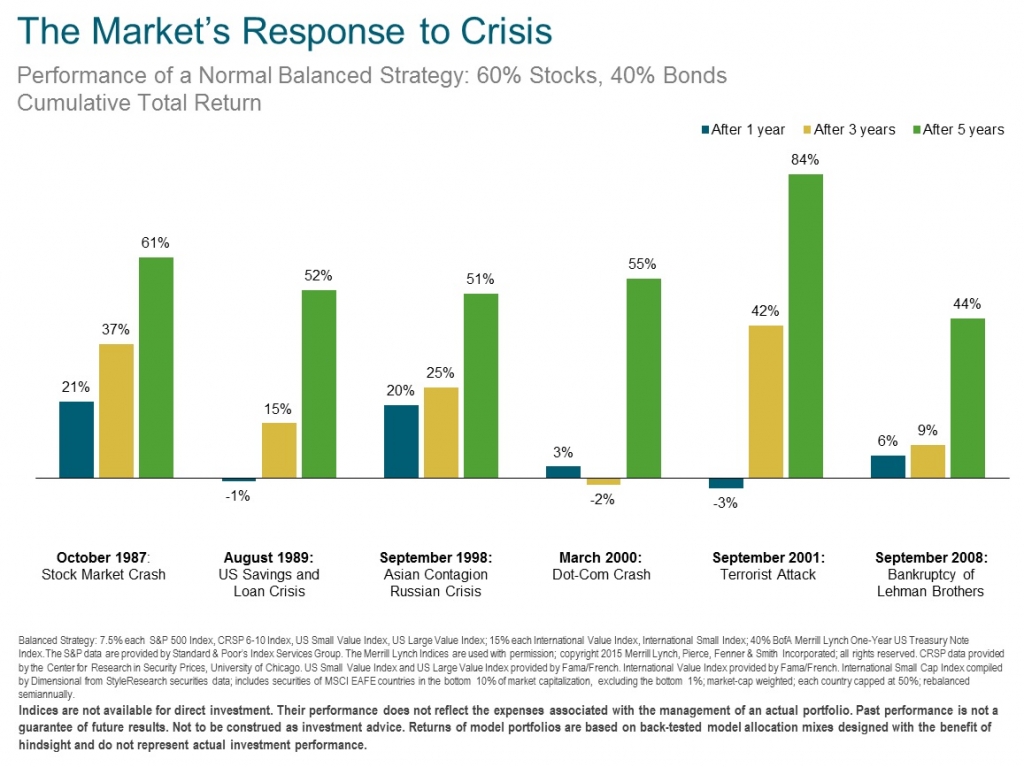
4.     Do I have to outsmart the market to be a successful investor?

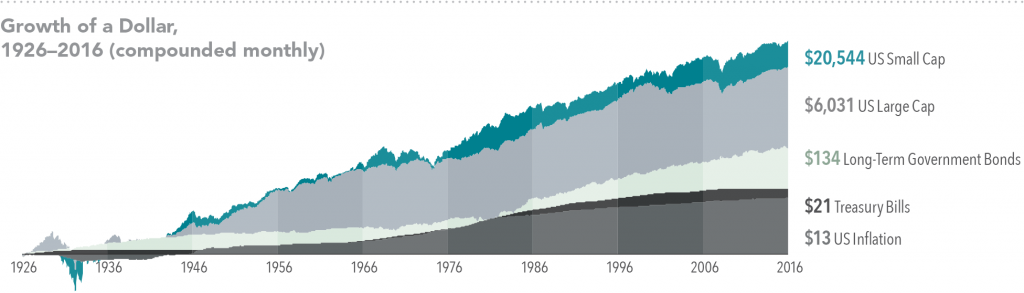
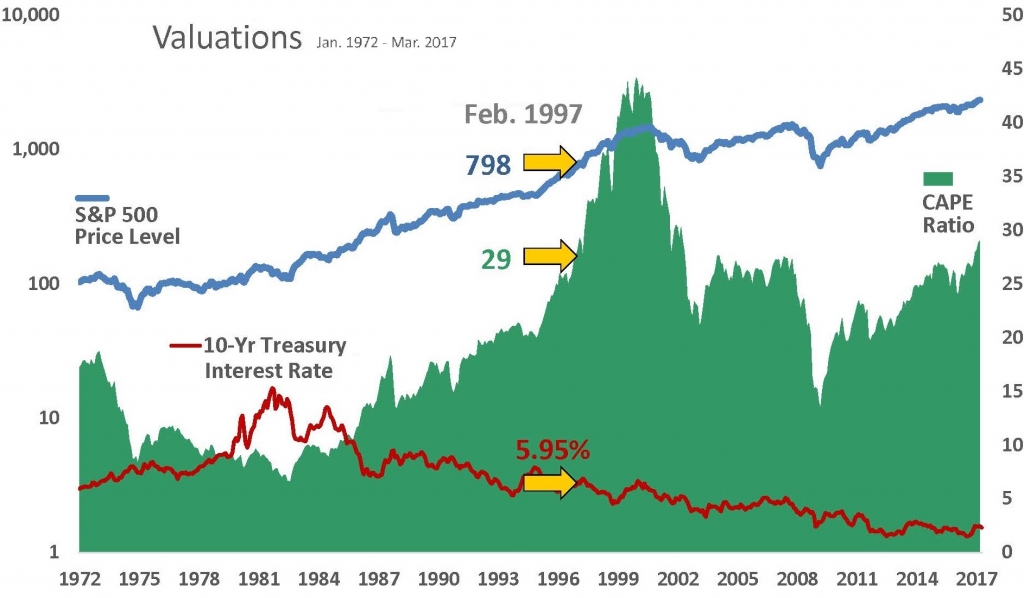
Financial markets have rewarded long-term investors. People expect a positive return on the capital they invest, and historically, the equity and bond markets have provided growth of wealth that has more than offset inflation. Instead of fighting markets, let them work for you.

US Small Cap is the CRSP 6–10 Index. US Large Cap is the S&P 500 Index. Long-Term Government Bonds is the IA SBBI US LT Govt TR USD, provided by Ibbotson Associates via Morningstar Direct. Treasury Bills is the IA SBBI US 30 Day TBill TR USD, provided by Ibbotson Associates via Morningstar Direct. US Inflation is measured as changes in the US Consumer Price Index. US Consumer Price Index data is provided by the US Department of Labor Bureau of Labor Statistics. CRSP data is provided by the Center for Research in Security Prices, University of Chicago. The S&P data is provided by Standard & Poor’s Index Services Group. Indices are not available for direct investment. Index performance does not reflect the expenses associated with the management of an actual portfolio. Past performance is no guarantee of future results.


5.    Is there a better way to build a portfolio?

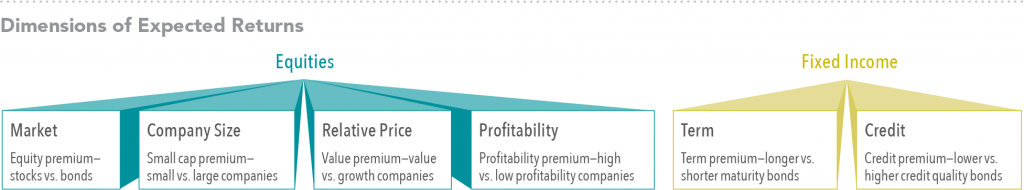
Academic research has identified these equity and fixed income dimensions, which point to differences in expected returns among securities. Instead of attempting to outguess market prices, investors can instead pursue higher expected returns by structuring their portfolio around these dimensions.

Relative price is measured by the price-to-book ratio; value stocks are those with lower price-to-book ratios. Profitability is a measure of current profitability based on information from individual companies’ income statements.


6.     Is international investing for me?

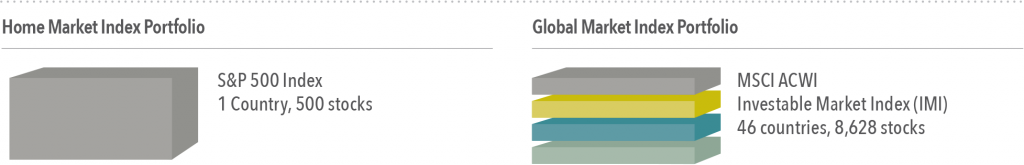
Diversification helps reduce risks that have no expected return, but diversifying only within your home market may not be enough. Instead, global diversification can broaden your investment opportunity set. By holding a globally diversified portfolio, investors are well positioned to seek returns wherever they occur.

Number of holdings and countries for the S&P 500 Index and MSCI ACWI (All Country World Index) Investable Market Index (IMI) as of December 31, 2016. The S&P data is provided by Standard & Poor’s Index Services Group. MSCI data ©MSCI 2017, all rights reserved. International investing involves special risks such as currency fluctuation and political stability. Investing in emerging markets may accentuate those risks. Diversification does not eliminate the risk of market loss. Indices are not available for direct investment


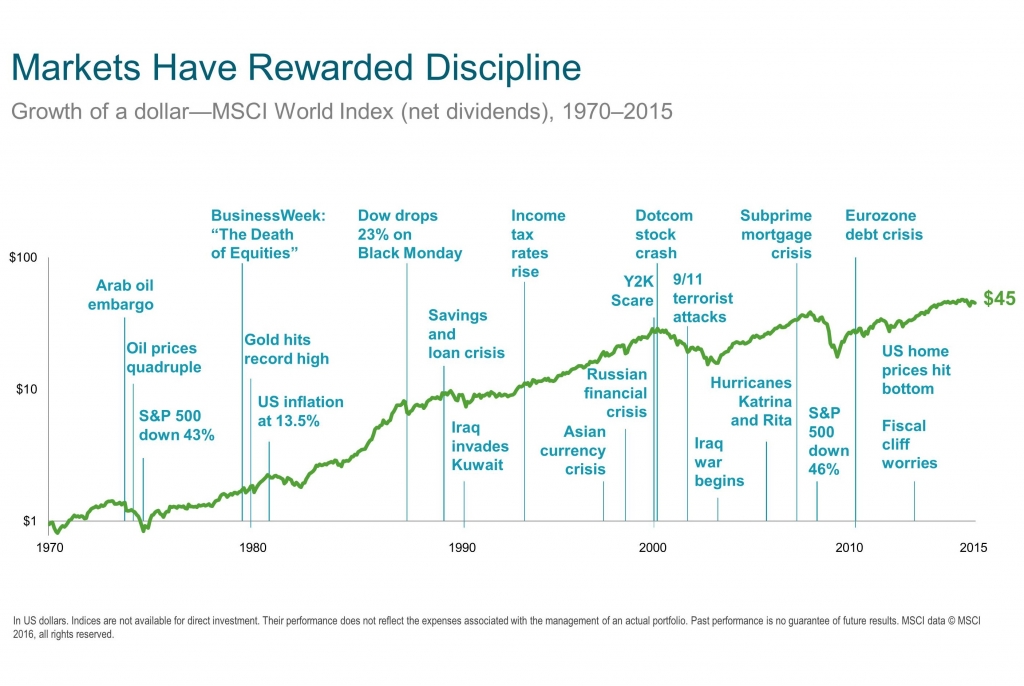
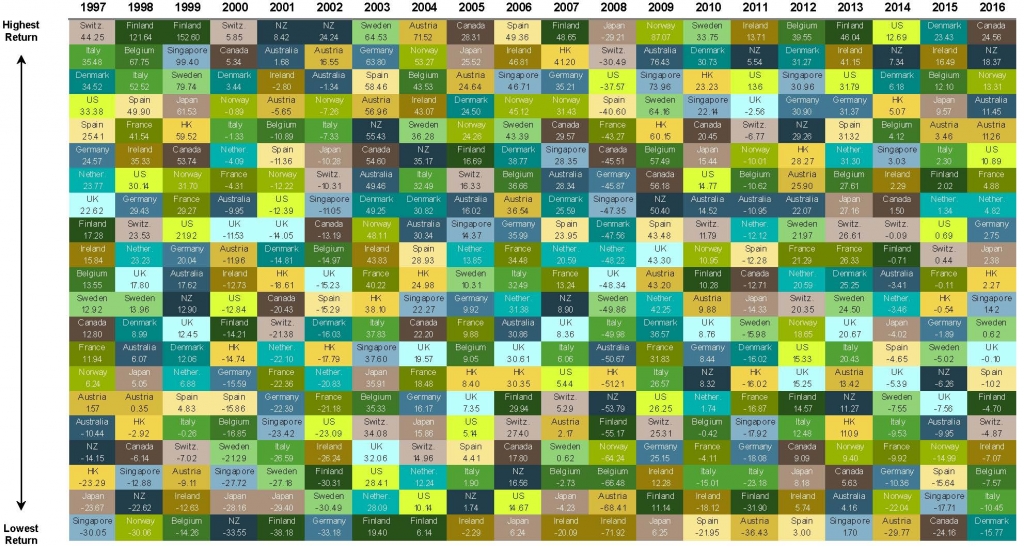
7.     Will making frequent changes to my portfolio help me achieve investment success?

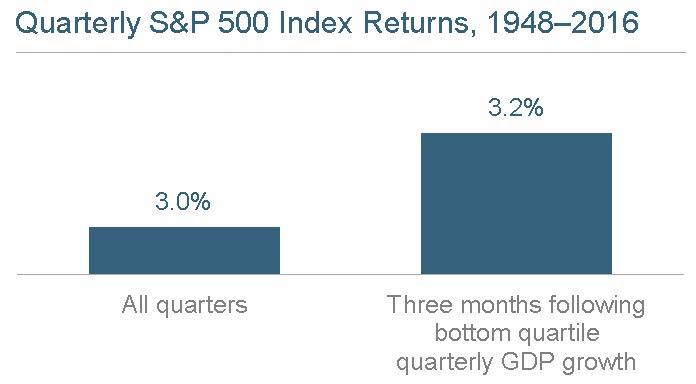
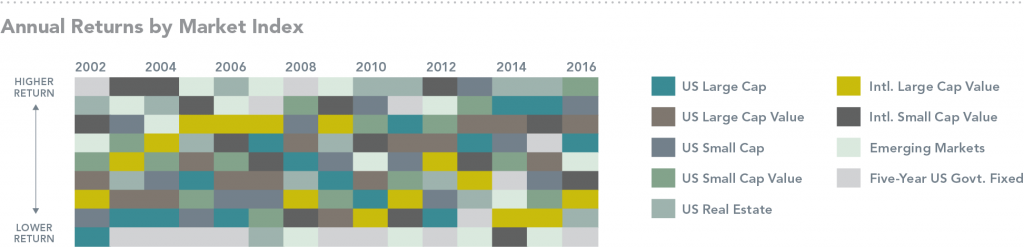
It’s tough, if not impossible, to know which market segments will outperform from period to period.

Accordingly, it’s better to avoid market timing calls and other unnecessary changes that can be costly. Allowing emotions or opinions about short-term market conditions to impact long-term investment decisions can lead to disappointing results.

US Large Cap is the S&P 500 Index. US Large Cap Value is the Russell 1000 Value Index. US Small Cap is the Russell 2000 Index. US Small Cap Value is the Russell 2000 Value Index. US Real Estate is the Dow Jones US Select REIT Index. International Large Cap Value is the MSCI World ex USA Value Index (net dividends). International Small Cap Value is the MSCI World ex USA Small Cap Value Index (net dividends). Emerging Markets is the MSCI Emerging Markets Index (net dividends). Five-Year US Government Fixed is the Bloomberg Barclays US TIPS Index 1–5 Years. The S&P data is provided by Standard & Poor’s Index Services Group. Frank Russell Company is the source and owner of the trademarks, service marks, and copyrights related to the Russell Indexes. Dow Jones data provided by Dow Jones Indices. MSCI data ©MSCI 2017, all rights reserved. Bloomberg Barclays data provided by Bloomberg. Indices are not available for direct investment. Index performance does not reflect the expenses associated with the management of an actual portfolio. Past performance is no guarantee of future results.


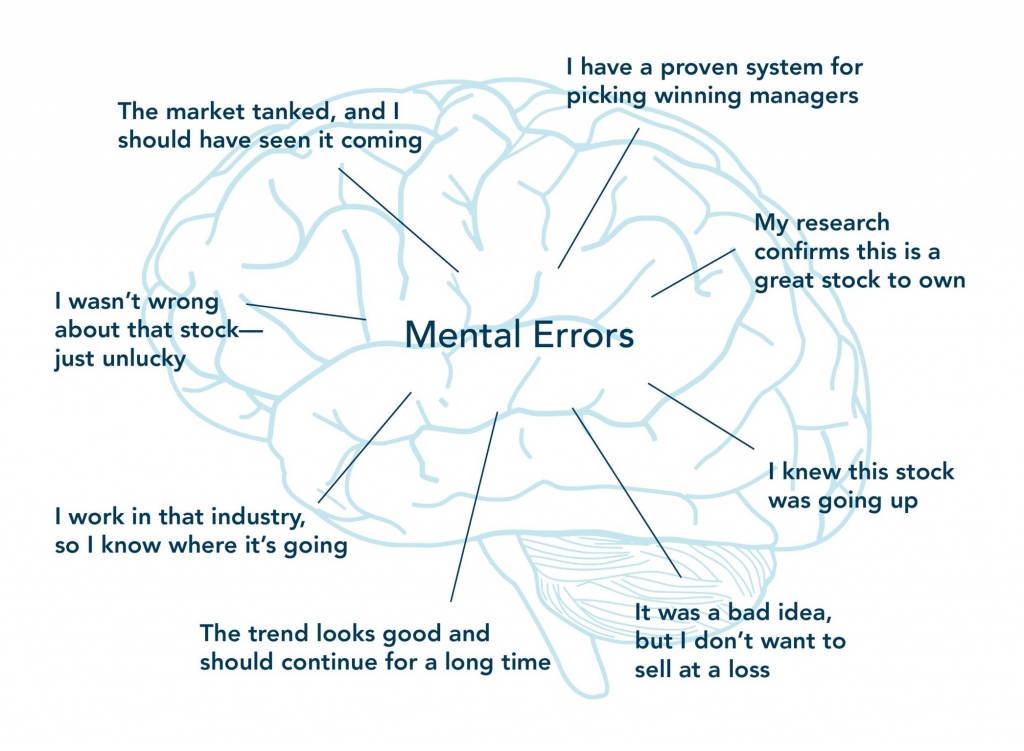
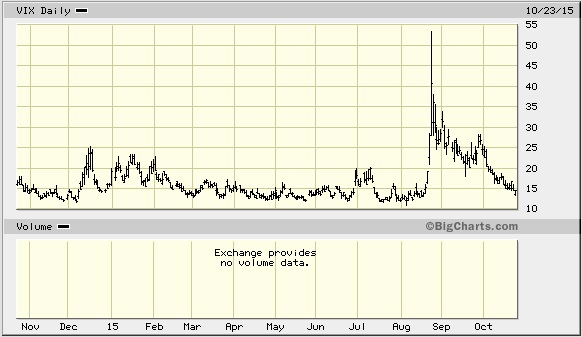
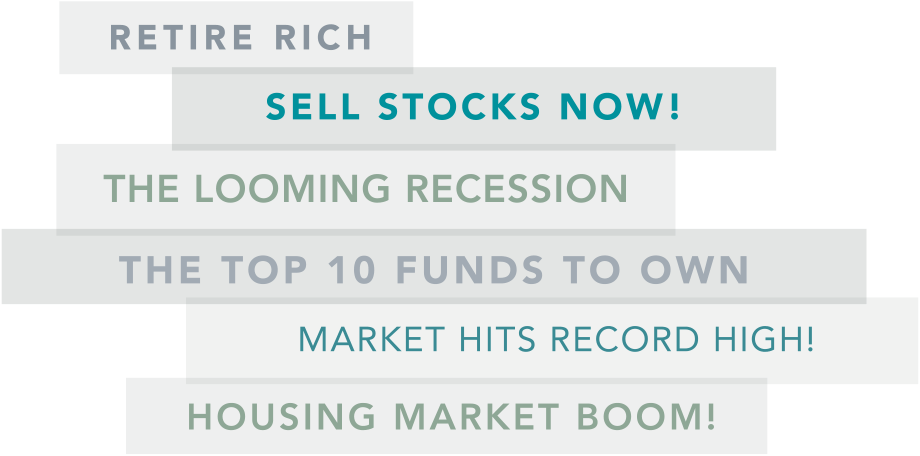
8.     Should I make changes to my portfolio based on what I’m hearing in the news?

Daily market news and commentary can challenge your investment discipline. Some messages stir anxiety about the future, while others tempt you to chase the latest investment fad. If headlines are unsettling, consider the source and try to maintain a long-term perspective.


9.     So, what should I be doing?

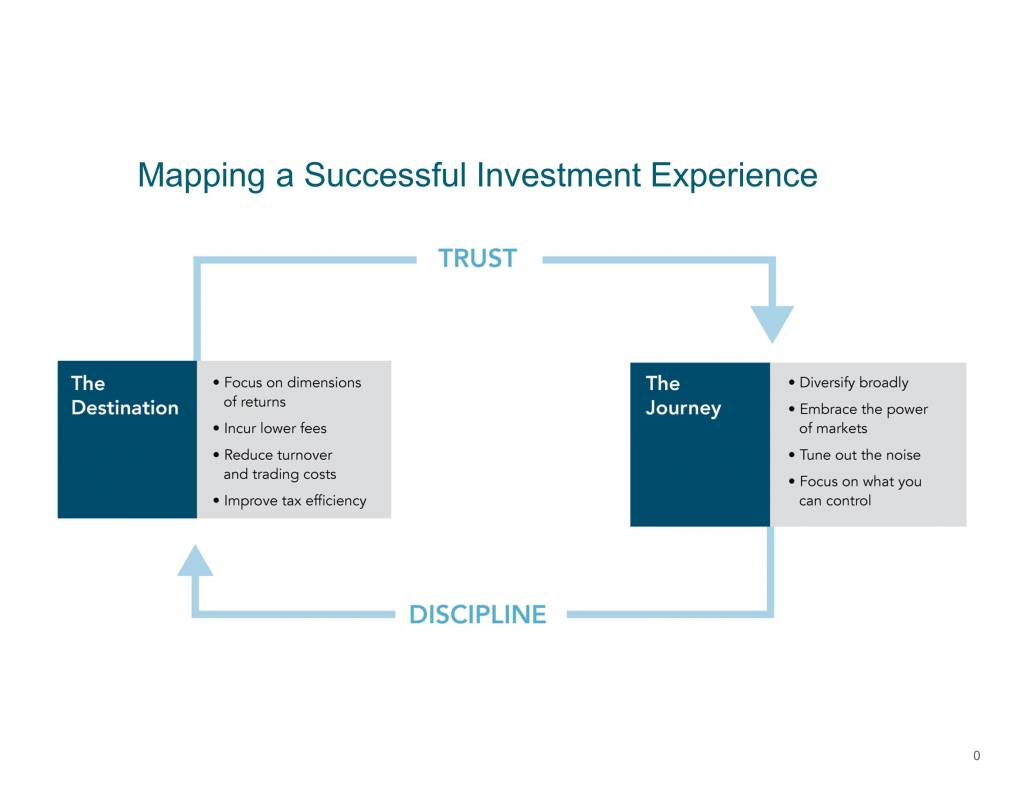
Work closely with a financial advisor who can offer expertise and guidance to help you focus on actions that add value. Focusing on what you can control can lead to a better investment experience.

  • Create an investment plan to fit your needs and risk tolerance.
  • Structure a portfolio along the dimensions of expected returns.
  • Diversify globally.
  • Manage fund expense ratios, turnover, and taxes.
  • Stay disciplined through market dips and swings.

Past performance does not guarantee future results. All investments include risk and have the potential for loss as well as gain.

Data sources for returns and standard statistical data are provided by the sources referenced and are based on data obtained from recognized statistical services or other sources we believe to be reliable. However, some or all information has not been verified prior to the analysis, and we do not make any representations as to its accuracy or completeness. Any analysis nonfactual in nature constitutes only current opinions, which are subject to change. Benchmarks or indices are included for information  purposes  only  to  reflect  the  current  market  environment;  no  index  is  a directly  tradable  investment.  There  may  be  instances  when  consultant  opinions  regarding any fundamental or quantitative analysis do not agree.

The  commentary  contained  herein  has  been  compiled  by  W.  Reid  Culp,  III  from  sources  provided  by  TAGStone  Capital,  Capital  Directions,  DFA,  Vanguard,  Morningstar,  as  well  as  commentary  provided  by  Mr.  Culp,  personally,  and  information  independently  obtained  by  Mr.  Culp.  The  pronoun  “we,”  as  used  herein,  references collectively the sources noted above.

TAGStone Capital, Inc. provides this update to convey general information about market conditions and not for the purpose of providing investment advice. Investment in any of the companies or sectors mentioned herein may not be appropriate for you. You should consult your advisor from TAGStone for investment advice regarding your own situation.


Stock Investing at All-Time Highs

As stock markets, once again, continue to hit all-time highs, investors take this news not with celebration, but with trepidation.

Modern stock markets have been worrying investors with new highs since they were created several centuries ago. For example, in 1955, Benjamin Graham, the great teacher of Warren Buffett, was called before Congress to testify about the level of the stock market—and answer the question: “is the market too high.” At the time, the Dow was up 56% from September 1953 to March 1955 and had just returned to its 1929 peak. The Senate committee wanted to ensure abusive actions were not going to create another meltdown—or as the chairman put it, “a final orgy of buying.”

To give a sense of the discussion, below is an excerpt of the statement from Mr. Graham:

"The true measure of common stock values, of course, is not found by reference to price movement alone, but by price in relation to earnings, dividends, future prospects, and to a small extent, asset values.

The Dow Jones industrials are now at a lower ratio to their average earnings in the past than they were at their highs in 1929, 1937, and 1946…. It should be pointed out also that high-grade interest rates are now definitely lower than in previous bull markets except for 1946. Lower basic interest rates presumably justify a higher value for each dollar of dividends or earnings.

Such a figure, if reliable would have to be regarded as rather reassuring. It would indicate that the market in terms of value is no higher now than it was in early 1926, or in early 1936, or late 1946.
It is fair to say the market is not too high today if we really managed to lick the business cycle. Although such a development would involve a revolutionary break with the past, I am not prepared to deny its possibility.

In my view, the fundamental reason for the rise [in the market since September 1953] was the swing from doubt to confidence—from emphasis on the risks in common stocks to the emphasis on the opportunities in common stocks.

My studies have led to the conclusion that sentiment alone, not supported by any visible change in value, will produce a swing on the order of 100 to 250 or 100 to 300 in price.”

An interesting point to note is that the level of the stock market that the senators were so concerned with was the Dow reaching 381. As we know to-day, the Dow crossed 22,000 for the first time on August 2, 2017.

Five Thoughts on the Stock Market

In the context of today’s all-time market highs, Mr. Graham’s 1955 testimony brings several things to mind about the stock market:

1.  Maintain an Asset Allocation that Can Withstand a Market Downturn:

As Mr. Graham stated, the stock market moves in cycles. The common anxiety investors face when investing in a historically high market is the fear of buying at the top, just in time to catch a downturn. And, as you can see in the chart below, the average bear market return, from peak-to-trough has been ‑45%.

A major investment risk individuals encounter during these periods is the risk that the investor sells his or her stock positions during a downturn, turns “paper losses” into real losses, and misses the ensuing bull market. This is why we recommend that you maintain an allocation to stocks and bonds that you can stick with through a market downturn.

In addition, it is important to allocate stock investments across several asset classes, such as small foreign stocks, international and U.S. REIT stocks, and emerging markets stocks. This asset class diversification greatly reduces the risk of being concentrated in a single asset class (such as large U.S. stocks) that endures a decades-long downturn and increases the opportunity to invest in some asset classes that may have lower valuations and produce positive returns.

2.  Stock Prices Follow Investor Expectations in the Short Run:

As Mr. Graham concluded, investor sentiment alone can create large swings in the stock price regardless of any change in real economic value. At any given time, investors can become overly optimistic about stocks or overly pessimistic about stocks.

Mr. Graham’s student, Warren Buffett, might have said it best: “In the short run, the stock market is a voting machine; in the long run, it is a weighing machine.”


5 Thoughts on the Stock Market (continued)

3.  Stock Valuations, in the Long Run, are Related to Corporate Earnings and Cash Flows:

As Buffett’s quote states, stock valuations, in the long run, are related to corporate earnings and cash flows. 

At the present time, the S&P 500 is highly valued by most metrics, but as shown in the table below from Goldman Sachs, the free cash flow yield on the S&P 500 is about 4.2%, almost directly on par with its long-term average of 4.0%, showing that the S&P 500 is fairly valued from this measure. 

4.  When stocks go down, investors become less inclined to invest, not more inclined:

There is a misguided belief among many investors that they will happily jump back into the stock market once a significant downturn has occurred. “Once we get a 20% downturn, I’ll invest,” goes the thinking.

But during such downturns, fear has usually gripped the market and news headlines are obsessed with how far the market has fallen and how much farther it will go.

Instead of feeling encouraged that stocks are a good buy, investors usually become more cautious, fearing they will put money into stocks only to see the market continue to fall. Instead investors usually continue to sit on the sidelines, waiting until things “calm down.”

5.  Investing Near All-Time Highs is Part of Stock Investing:

Investing near all-time highs is part of stock investing. As shown in the graph to the right, the stock market, from January 1926 to December 2016, has closed at new month-end highs almost 30% of the time.

Historically, however, new highs have not been useful predictors of future returns. As the graph indicates, the chances of positive monthly returns over any 12-month period is about the same, whether the market is hitting a new high or not.

The Bottom Line

The bottom line is that making subjective decisions about when to invest in stocks is difficult. In a fully-valued market like today, investors should be prepared for a market downturn, even though a fully-valued market does not mean that a downturn is imminent. Instead, a market drawdown can occur at any time or any level of the market.

Instead of trying to time the market, TAGStone Capital recommends choosing a prudent investment strategy that you can stick with through any market conditions. Studies have shown that the average investor times the market poorly, getting in at the top and getting out at the bottom, and achieves below available returns.

When asked by the Senate chairman how he deals with market levels in his business, Mr. Graham responded insightfully:

"I have never specialized in economic forecasting or market forecasting either. My own business has been largely based on the principle that if you can make your results independent of any views as to the future you are that much better off.

I think our success is due to our having established sound principles of purchase and sale of securities and having followed them consistently through all kinds of markets."


Past performance does not guarantee future results. All investments include risk and have the potential for loss as well as gain.

Data sources for returns and standard statistical data are provided by the sources referenced and are based on data obtained from recognized statistical services or other sources we believe to be reliable. However, some or all information has not been verified prior to the analysis, and we do not make any representations as to its accuracy or completeness. Any analysis nonfactual in nature constitutes only current opinions, which are subject to change. Benchmarks or indices are included for information  purposes  only  to  reflect  the  current  market  environment;  no  index  is  a directly  tradable  investment.  There  may  be  instances  when  consultant  opinions  regarding any fundamental or quantitative analysis do not agree.

The  commentary  contained  herein  has  been  compiled  by  W.  Reid  Culp,  III  from  sources  provided  by  TAGStone  Capital,  Capital  Directions,  DFA,  Vanguard,  Morningstar,  as  well  as  commentary  provided  by  Mr.  Culp,  personally,  and  information  independently  obtained  by  Mr.  Culp.  The  pronoun  “we,”  as  used  herein,  references collectively the sources noted above.

TAGStone Capital, Inc. provides this update to convey general information about market conditions and not for the purpose of providing investment advice. Investment in any of the companies or sectors mentioned herein may not be appropriate for you. You should consult your advisor from TAGStone for investment advice regarding your own situation.


The Uncertainty Paradox

Doubt is not a pleasant condition, but certainty is an absurd one. —Voltaire

“The market hates uncertainty” has been a common enough saying in recent years, but how logical is it? There are many different aspects to uncertainty, some that can be measured and some that cannot. Uncertainty is an unchangeable condition of existence. As individuals, we can feel more or less uncertain, but that is a distinctly human phenomenon. Rather than ebbing and flowing with investor sentiment, uncertainty is an inherent and ever-present part of investing in markets. Any investment that has an expected return above the prevailing “risk-free rate” (think T-Bills for US investors) involves trading off certainty for a potentially increased return.

Consider this concept through the lens of stock vs. bond investments. Stocks have higher expected returns than bonds largely because there is more uncertainty about the future state of the world for equity investors than bond investors. Bonds, for the most part, have fixed coupon payments and a maturity date at which principal is expected to be repaid. Stocks have neither. Bonds also sit higher in a company’s capital structure. In the event a firm goes bust, bondholders get paid before stockholders. So, do investors avoid stocks in favor of bonds because of this increased uncertainty? Quite the contrary, many investors end up allocating capital to stocks due to their higher expected return. In the end, many investors are often willing to make the trade off of bearing some increased uncertainty for potentially higher returns.

Managing Emotions: While the statement “the market hates uncertainty” may not be totally logical, it doesn’t mean it lacks educational value. Thinking about what the statement is expressing allows us to gain insight into the mindset of individuals. The statement attempts to personify the market by ascribing the very real nervousness and fear felt by some investors when volatility increases. It is recognition of the fact that when markets go up and down, many investors struggle to separate their emotions from their investments. It ultimately tells us that for many an investor, regardless of whether markets are reaching new highs or declining, changes in market prices can be a source of anxiety. During these periods, it may not feel like a good time to invest. Only with the benefit of hindsight do we feel as if we know whether any time period was a good one to be invested. Unfortunately, while the past may be prologue, the future will forever remain uncertain.

Staying in Your Seat: In a recent interview, David Booth, the founder of Dimensional Fund Advisors, was asked about what it means to be a long-term investor:

“People often ask the question, ‘How long do I have to wait for an investment strategy to pay off? How long do I have to wait so I’m confident that stocks will have a higher return than money market funds, or have a positive return?’ And my answer is it’s at least one year longer than you’re willing to give. There is no magic number. Risk is always there.”

Part of being able to stay unemotional during periods when it feels like uncertainty has increased is having an appropriate asset allocation that is in line with an investor’s willingness and ability to bear risk. It also helps to remember that, during what feels like good times and bad, one wouldn’t expect to earn a higher return without taking on some form of risk. While a decline in markets may not feel good, having a portfolio you are comfortable with, understanding that uncertainty is part of investing, and sticking to a plan that is agreed upon in advance and reviewed on a regular basis can help keep investors from reacting emotionally. This may ultimately lead to a better investment experience.

Investment Shock Absorbers

Ever ridden in a car with worn-out shock absorbers? Every bump is jarring, every corner stomach-churning, and every red light an excuse to assume the brace position. Owning an undiversified portfolio can trigger similar reactions.[1]

Throw in the risk of a breakdown or running off the road altogether, and there’s a real chance you may not reach your destination. In the world of investment, a similarly bumpy and unpredictable ride can await those with concentrated and undiversified portfolios or those who constantly tinker with their allocation.

Of course, everyone feels in control when the surface is straight and smooth, but it’s harder to stay on the road during sudden turns and ups and downs in the market.

For that reason, the smart thing to do is to diversify, spreading your portfolio across different securities, sectors, and countries. That also means identifying the right mix of investments (e.g., stocks, bonds, real estate) that aligns with your risk tolerance.

Using this approach, your returns from year to year may not match the top performing portfolio, but neither are they likely to match the worst. More importantly, this is a ride you are likelier to stick with.

Here’s an example. Among developed markets, Denmark was number one in US dollar terms in 2015 with a return of more than 23%. But a big bet on that country the following year would have backfired, as Denmark slid to bottom of the table with a loss of nearly 16%.[2]

It’s true that the US stock market (by far the world’s biggest) has been a strong performer in recent years. But a decade before, in 2004 and 2006, it was the second worst-performing developed market in the world.

Predicting which part of a market will do best over a given period is tough. US small cap stocks were among the top performers in 2016 with a return of more than 21%. A year before, their results looked relatively disappointing with a loss of more than 4%. International small cap stocks had their turn in the sun in 2015, topping the performance tables with a return of just below 6%. But the year before that, they were the second worst with a loss of 5%. [3]

Investment Shock Absorbers (Continued)

If you’ve ever taken a long road trip, you’ll know that conditions along the way can change quickly and unpredictably, which is why you need a vehicle that’s ready for the worst roads as well as the best. While diversification can never completely eliminate the impact of bumps along your particular investment road, it does help reduce the potential outsized impact that any individual investment can have on your journey.

[1] Adapted from “Investment Shock Absorbers,” Outside the Flags, February 2017.

[2] In US dollars. MSCI developed markets country indices (net dividends).

[3] In US dollars. US Small Cap is the Russell 2000 Index. International Small Cap is the MSCI World ex USA Small Cap Index (gross dividends).

High Valuations Conundrum

Much research has been done on stock valuations, and historically buying into the market at lower valuations has seen higher returns than when buying in at higher valuations. However, the data is noisy. 

On the following chart, the green area represents the 10-year trailing price-to-earnings (P/E) ratio of the S&P 500, commonly referred to as the CAPE ratio. You can think of this as a gauge to see if the overall price of the stock market is expensive or cheap. As you can see, we’re currently at a fairly-elevated level, around 29 dollars of price for every dollar of earnings, though far below the peaks seen in 2000. [4]

It can be enticing to think it’s possible to time the market based on valuation ratios like these, but even the creator of this ratio, Professor Robert Shiller, cautions against using the ratio to make trades. And keep in mind you have to guess right not once, but twice — knowing when to get back into the market.

Take, for example, the last time the 10-year trailing P/E ratio of the S&P 500 broke through the current level was in February 1997. If you had sold out fearing high valuations at that time, you would have missed out on another three years of up markets, cumulating an additional 86% gain before seeing any meaningful decline.

At that point in February 1997, the S&P 500 was trading at 798; if you sold out waiting to buy back in once the market was lower, you would have had to wait twelve years, until March 2009. And if you missed that brief opportunity, you might still be waiting some 20 years later. Meanwhile, the S&P 500 is above 2,300.

Furthermore, it is important to note the level of interest rates over the last 20 years, as they are a major force on stock prices. A stock is generally valued by how much cash can be obtained from the company between now and judgment day, discounted by a benchmark rate. Many stock investors use the yield on the 10-year US Treasury bond as their benchmark rate, because it is assumed to be risk free and generally matches their investment time horizon.

In February 1997, the yield on the 10-year Treasury was 5.95%, and it has steadily declined since then, now standing at 2.38%, as of March 31, 2017. This might seem like a small change of only 3.57% (5.95% - 2.38% = 3.57%), but in percentage terms, it is a large 60% decrease (3.57% / 5.95% = 60%).

In the stock price equation, when the discount rate goes down, stock prices go up, and, at these levels, small changes in the discount rate can have a significant effect on an investor’s final valuation of a stock—this is just mathematics.

The difficulty arises in trying to predict the future scenario for interest rates. If an investor assumes these low levels of interest rates will continue for a long time, then stock prices look cheap, and they should buy, buy, buy. However, if an investor assumes interest rates will rise, then stocks start to look fully valued to expensive.

And both interest rate scenarios are a reality—for the low interest rate outcome just look to Japan over the last 30 years or the US in the 1940s, and for the high interest rate outcome look to the US in the 1980s.

Therefore, at TAGStone Capital, we recommend a balanced approach between stocks and bonds, with an appropriate rebalancing strategy, in case either scenario plays out. Instead of trying to predict what interest rates will be in three to ten years, we think a better strategy is to target dimensions of higher returns (size, value, and profitability) and stay the course when the market gets bumpy.

[4] Source: Robert Shiller Online Data library via Yale. CAPE tracks current S&P 500 price versus average of inflation-adjusted earnings over previous 10 years.


Past performance does not guarantee future results. All investments include risk and have the potential for loss as well as gain.

Data sources for returns and standard statistical data are provided by the sources referenced and are based on data obtained from recognized statistical services or other sources we believe to be reliable. However, some or all information has not been verified prior to the analysis, and we do not make any representations as to its accuracy or completeness. Any analysis nonfactual in nature constitutes only current opinions, which are subject to change. Benchmarks or indices are included for information  purposes  only  to  reflect  the  current  market  environment;  no  index  is  a directly  tradable  investment.  There  may  be  instances  when  consultant  opinions  regarding any fundamental or quantitative analysis do not agree.

The  commentary  contained  herein  has  been  compiled  by  W.  Reid  Culp,  III  from  sources  provided  by  TAGStone  Capital,  Capital  Directions,  DFA,  Vanguard,  Morningstar,  as  well  as  commentary  provided  by  Mr.  Culp,  personally,  and  information  independently  obtained  by  Mr.  Culp.  The  pronoun  “we,”  as  used  herein,  references collectively the sources noted above.

TAGStone Capital, Inc. provides this update to convey general information about market conditions and not for the purpose of providing investment advice. Investment in any of the companies or sectors mentioned herein may not be appropriate for you. You should consult your advisor from TAGStone for investment advice regarding your own situation.


The Power of Markets

In 1958, economist Leonard Read published an essay entitled “I, Pencil: My Family Tree as Told to Leonard E. Read.”1

The essay, narrated from the point of view of a pencil, describes the “complex combination of miracles” necessary to create and bring to market the commonplace writing tool that has been used for generations. The narrator argues that no single individual possesses enough ability or know-how to create a pencil on their own. Rather, the mundane pencil—and the ability to purchase it for a “trifling” sum—is the result of an extraordinary process driven by the knowledge of market participants and the power of market prices.

The Importance of Price

Upon observing a pencil, it is tempting to think a single individual could easily make one. After all, it is made up of common items such as wood, paint, graphite, metal, and a rubber eraser. By delving deeper into how these seemingly ordinary components are produced, however, we begin to understand the extraordinary backstory of their synthesis. Take the wood as an example: To produce wood requires a saw, to make the saw requires steel, to make steel requires iron. That iron must be mined, smelted, and shaped. A truck, train, or boat is needed to transport the wood from the forest to a factory where numerous machines convert it into lumber. The lumber is then transported to another factory where more machines assemble the pencil. Each of the components mentioned above and each step in the process have similarly complex backstories. All require materials that are sourced from far-flung locations, and countless processes are involved in refining them. While the multitude of inputs and processes necessary to create a pencil is impressive, even more impressive are the coordinated actions required by millions of people around the world to bring everything together. There is the direct involvement of farmers, loggers, miners, factory workers, and the providers of capital. There is also the indirect involvement of millions of others—the makers of rails, railroad cars, ships, and so on. Market prices are the unifying force that enables these millions of people to coordinate their actions efficiently.2

Workers with specific knowledge about their costs, constraints, and efforts use market prices to leverage the knowledge of others to decide how to direct their own resources and make a living. Consider the farmer, the logger, and the price of a tree. The farmer will have a deep understanding of the costs, constraints, and efforts required to grow trees. To increase profit, the farmer will seek out the highest price when selling trees to a logger. After purchasing the trees, the logger will convert them to wood and sell that wood to a factory. The logger understands the costs, constraints, and efforts required to do this, so to increase profit, the logger seeks to pay the lowest price possible when buying trees from the farmer. When the farmer and the logger agree to transact, the agreed upon price reflects their combined knowledge of the costs and constraints of both growing and harvesting trees. That knowledge allows them to decide how to efficiently allocate their resources in seeking a profit. Ultimately, it is price that enables this coordination. On a much larger scale, price formation is facilitated by competition between the many farmers that sell trees to loggers and between the many loggers that buy trees from farmers. This market price of trees is observable and can be used by others in the production chain (e.g., the lumber factory mentioned above) to inform how much they can expect to pay for wood and to plan how to allocate their resources accordingly.

The Power of Financial Markets

There is a corollary that can be drawn between this narrative about the market for goods and the financial markets. Generally, markets do a remarkable job of allocating resources, and financial markets allocate a specific resource: financial capital. Financial markets are also made up of millions of participants, and these participants voluntarily agree to buy and sell securities all over the world based upon their own needs and desires. Each day, millions of trades take place, and the vast collective knowledge of all of these participants is pooled together to set security prices. Exhibit 1 shows the staggering magnitude of participation in the world equity markets on an average day in 2015.3

Any individual trying to outguess the market is competing against the extraordinary collective wisdom of all of these buyers and sellers. Viewed through the lens of Read’s allegory, attempting to outguess the market is like trying to create a pencil from scratch rather than going to the store and reaping the fruits of others’ willingly supplied labor. In the end, trying to outguess the market is incredibly difficult and expensive. One doesn’t have to look far for data that supports this. Exhibit 2 shows that only 17% of US equity mutual funds have survived and outperformed their benchmarks over the past 15 years.4

The Rewards of Providing Capital

The beauty of Leonard Read’s story is that it provides a glimpse of the incredibly complex tapestry of markets and how prices are formed, what types of information they contain, and how they are used. The story makes it clear that no single individual possesses enough ability or know-how to create a pencil on their own but rather that the pencil’s miraculous production is the result of the collective input and effort of countless motivated human beings. In the end, the power of markets benefits all of us. The market allows us to exchange the time we require to earn money for a few milliseconds of each person’s time involved in making a pencil. For an investor, we believe the lesson here is that instead of fighting the market, one should pursue an investment strategy that efficiently and effectively harnesses the extraordinary collective power of market prices. That is, an investment strategy that uses market prices and the information they contain in its design and day-to-day management. In doing so, an investor has access to the rewards that financial markets make available to providers of capital.

The Election: A Vote for Small Cap Stocks?

In the days immediately following the recent US presidential election, US small company stocks experienced higher returns than US large company stocks. This example helps illustrate how the dimensions of expected returns can appear quickly, unpredictably, and with large magnitude.

Average returns for US small company stocks historically have been higher than the average returns for US large company stocks. But those returns include long periods of both strong and weak relative performance.

Investors may attempt to enhance returns by increasing their exposure to small company stocks at what appear to be the most opportune times. Yet this effort to time the size premium can be frustrating because the most rewarding results often occur in an unpredictable manner.

A recent paper5 by Wei Dai, PhD, explores the challenges of attempting to time the size, value, and profitability premiums.6

Here we will keep the discussion to a simpler example. As of October 31, 2016, small company stocks had outpaced large company stocks for the year-to-date by 0.34 percentage points.

To the surprise of many market observers, the broad stock market rose following the US presidential election on November 8, with small company stocks outperforming the market as a whole. In the eight trading days following the US presidential election, the small cap premium, as measured by the return difference between the Russell 2000 and Russell 1000, was 7.8 percentage points. This helped small company stocks pull ahead of large company stocks year-to-date, as of November 30, by approximately 8 percentage points and for a full one-year period by approximately 4 percentage points.

This recent example highlights the importance of staying disciplined. The premiums associated with the size, value, and profitability dimensions of expected returns may show up quickly and with large magnitude. There is no guarantee that the size premium will be positive over any period, but investors put the odds of achieving augmented returns in their favor by maintaining constant exposure to the dimensions of higher expected returns.

Riding the Wave

As the Dow Jones Industrial Average attempts to cross the 20,000 point mark and other stock market indices hit all-time highs, some investors might fear the market is “overvalued” or “too high.” While savvy investors know that market corrections occur and that they can occur fast, furiously, and unexpectedly, they also know that it’s hard to time a correction, because you must be right two times. First, in getting out of the market, and second, in getting back in.

On trying to predict corrections, the great stock investor, Peter Lynch, said, "Far more money has been lost by investors preparing for corrections, or trying to anticipate corrections, than has been lost in corrections themselves."

We saw this firsthand recently with those investors who moved to cash before the election and ultimately missed out on the post-election rally. It’s important to remember that stocks are forward-looking and typically “price in” anticipated news ahead of time. Moreover, when news changes, stocks incorporate this news into their prices quickly and before most investors can react.

Peter Lynch summarizes the difficulty of market timing by saying, "I can't recall ever once having seen the name of a market timer on Forbes' annual list of the richest people in the world. If it were truly possible to predict corrections, you'd think somebody would have made billions by doing it."

At TAGStone Capital, we think it is a tall task to say that the whole market is wrong or overpriced, because the market may be making rational assumptions about growth or discount rates, even if these assumptions are different from historical averages. Instead of trying to predict the value of the overall market, we think a better strategy is to target dimensions of higher returns (size, value, and profitability), which can present themselves at any time.

Furthermore, if a rational investor believes the market is being irrational—a state in which it can remain for some time—his optimal decision may be to partly ride the wave of optimism—given a predetermined stock/bond ratio and an appropriate rebalancing strategy.

[1] Leonard Read’s essay can be found here: http://econlib.org/library/Essays/rdPncl1.html.

[2] Source: Dimensional Fund Advisors LP, December 2016.

[3] US-domiciled mutual fund data is from the CRSP Survivor-Bias-Free US Mutual Fund Database, provided by the Center for Research in Security Prices, University of Chicago. Certain types of equity funds were excluded from the performance study. Index funds, sector funds, and funds with a narrow investment focus, such as real estate and gold, were excluded.

[4] Funds are identified using Lipper fund classification codes. Correlation coefficients are computed for each fund with respect to diversified benchmark indices using all return data available between January 1, 2001, and December 31, 2015. The index most highly correlated with a fund is assigned as its benchmark. Winner funds are those whose cumulative return over the period exceeded that of their respective benchmark. Loser funds are funds that did not survive the period or whose cumulative return did not exceed their respective benchmark.

[5] Wei Dai, “Premium Timing with Valuation Ratios” (white paper, Dimensional Fund Advisors, September 2016).

[6] Size premium: the return difference between small capitalization stocks and large capitalization stocks. Value premium: the return difference between stocks with low relative prices (value) and stocks with high relative prices (growth). Profitability premium: The return difference between stocks of companies with high profitability over those with low profitability.


Past performance does not guarantee future results. All investments include risk and have the potential for loss as well as gain.

Data sources for returns and standard statistical data are provided by the sources referenced and are based on data obtained from recognized statistical services or other sources we believe to be reliable. However, some or all information has not been verified prior to the analysis, and we do not make any representations as to its accuracy or completeness. Any analysis nonfactual in nature constitutes only current opinions, which are subject to change. Benchmarks or indices are included for information  purposes  only  to  reflect  the  current  market  environment;  no  index  is  a directly  tradable  investment.  There  may  be  instances  when  consultant  opinions  regarding any fundamental or quantitative analysis do not agree.

The  commentary  contained  herein  has  been  compiled  by  W.  Reid  Culp,  III  from  sources  provided  by  TAGStone  Capital,  Capital  Directions,  DFA,  Vanguard,  Morningstar,  as  well  as  commentary  provided  by  Mr.  Culp,  personally,  and  information  independently  obtained  by  Mr.  Culp.  The  pronoun  “we,”  as  used  herein,  references collectively the sources noted above.

TAGStone Capital, Inc. provides this update to convey general information about market conditions and not for the purpose of providing investment advice. Investment in any of the companies or sectors mentioned herein may not be appropriate for you. You should consult your advisor from TAGStone for investment advice regarding your own situation.


Presidential Elections and the Stock Market

Next month, Americans will head to the polls to elect the next president of the United States.

While the outcome is unknown, one thing is for certain: There will be a steady stream of opinions from pundits and prognosticators about how the election will impact the stock market. As we explain below, investors would be well‑served to avoid the temptation to make significant changes to a long‑term investment plan based upon these sorts of predictions.

Election Expectations Baked into Stock Prices

Trying to outguess the market is normally a losing game. Current market prices offer an up-to-the-minute snapshot of the aggregate expectations of market participants. This includes expectations about the outcome and impact of elections. While unanticipated future events—surprises relative to those expectations—may trigger price changes in the future, the nature of these surprises cannot be known by investors today. As a result, it is difficult, if not impossible, to systematically benefit from trying to identify mispriced securities. This suggests it is unlikely that investors can gain an edge by attempting to predict what will happen to the stock market after a presidential election.

Returns During and After Election Years

On average, market returns have been positive in both election years and the year subsequent to elections. The chart below shows average annual returns of the S&P 500 during an election year and the year subsequent to an election from 1928 to 2013. Over these periods, the S&P 500 returned 11.2% and 9.3%, respectively.

The chart illustrates that the annual returns surrounding an election are similar to the long-term returns of the S&P 500. This suggests that market expectations associated with election outcomes are embedded in security prices.

This can also be seen with the volatility and uncertainty that occurs when election outcomes are different from market expectations, as seen early this year with the Brexit vote. Leading up to the vote, the market predicted a “no” vote, but reacted strongly when the citizens of the United Kingdom voted in favor of leaving the European Union.

If the candidate or party trailing in the polls wins unexpectedly, the market must reprice the outcome, which results in volatility.

A similar risk story can be applied to the lower average returns following an election year. Some argue that the uncertainty surrounding a new administration’s policies leads to this result.

Short-term Trading and Presidential Election Results

Exhibit 1 shows the frequency of monthly returns (expressed in 1% increments) for the S&P 500 Index from January 1926 to June 2016. Each horizontal dash represents one month, and each vertical bar shows the cumulative number of months for which returns were within a given 1% range (e.g., the tallest bar shows all months where returns were between 1% and 2%). The blue and red horizontal lines represent months during which a presidential election was held. Red corresponds with a resulting win for the Republican Party and blue with a win for the Democratic Party. This graphic illustrates that election month returns were well within the typical range of returns, regardless of which party won the election.

Long-Term Investing: Bulls & Bears ≠ Donkeys & Elephants

Predictions about presidential elections and the stock market often focus on which party or candidate will be “better for the market” over the long run. Exhibit 2 shows the growth of one dollar invested in the S&P 500 Index over nine decades and 15 presidencies (from Coolidge to Obama). This data does not suggest an obvious pattern of long-term stock market performance based upon which party holds the Oval Office. The key takeaway here is that over the long run, the market has provided substantial returns regardless of who controlled the executive branch.

Vote for the Long Term

Equity markets can help investors grow their assets, but investing is a long-term endeavor. Trying to make investment decisions based upon the outcome of presidential elections is unlikely to result in reliable excess returns for investors.

At best, any positive outcome based on such a strategy will likely be the result of random luck. At worst, it can lead to costly mistakes. Accordingly, there is a strong case for investors to rely on patience and portfolio structure, rather than trying to outguess the market, in order to pursue investment returns.1

TAGStone remains committed to helping its clients have a good investment experience through this tumultuous election cycle. Its investment strategy is designed to capture factors of higher return that can present themselves at any time, including during this uncertain time. This is why, with your investment portfolio, we ask you to vote for the long term.

[1] Source: Dimensional Fund Advisors LP, October 2016.


Past performance does not guarantee future results. All investments include risk and have the potential for loss as well as gain.

Data sources for returns and standard statistical data are provided by the sources referenced and are based on data obtained from recognized statistical services or other sources we believe to be reliable. However, some or all information has not been verified prior to the analysis, and we do not make any representations as to its accuracy or completeness. Any analysis nonfactual in nature constitutes only current opinions, which are subject to change. Benchmarks or indices are included for information  purposes  only  to  reflect  the  current  market  environment;  no  index  is  a directly  tradable  investment.  There  may  be  instances  when  consultant  opinions  regarding any fundamental or quantitative analysis do not agree.

The  commentary  contained  herein  has  been  compiled  by  W.  Reid  Culp,  III  from  sources  provided  by  TAGStone  Capital,  Capital  Directions,  DFA,  Vanguard,  Morningstar,  as  well  as  commentary  provided  by  Mr.  Culp,  personally,  and  information  independently  obtained  by  Mr.  Culp.  The  pronoun  “we,”  as  used  herein,  references collectively the sources noted above.

TAGStone Capital, Inc. provides this update to convey general information about market conditions and not for the purpose of providing investment advice. Investment in any of the companies or sectors mentioned herein may not be appropriate for you. You should consult your advisor from TAGStone for investment advice regarding your own situation.


10 Reasons to be Cheerful

Do you ever listen to the news and find yourself thinking that the world has gone to the dogs?

The roll call of depressing headlines seems endless. But look beyond what the media calls news, and there are also a lot of things going right.

It’s true the world faces challenges in many areas, and the headlines reflect that. Europe has been grappling with a flood of refugees; as of May, the Chinese local A-share market declined by almost 20 percent; and the U.S. is in the middle of a sometimes-rancorous election campaign.

More recently, citizens of the United Kingdom voted to leave the European Union, creating significant uncertainty in markets over the long-term implications.

But it’s also easy to overlook the significant advances made in raising the living standards of millions, increasing global cooperation on various issues, and improving access to healthcare and other services around the world.

Many of the 10 developments cited below don’t tend to make the front pages of daily newspapers or the lead items in the TV news, but they’re worth keeping in mind on those occasions when you feel overwhelmed by all the grim headlines.

So here’s an alternative news bulletin:

1.  Over the last 25 years ending May 2016, one dollar invested in a global portfolio of stocks would have grown to more than five and a half dollars.1

2.  Over the last 25 years, 2 billion people globally have moved out of extreme poverty, according to the latest United Nations Human Development Report.2

3.  Over the same period, mortality rates among children under the age of 5 have fallen by 53%, from 91 deaths per 1000 to 43 deaths per 1000.

4.  Globally, life expectancy has been improving. From 2000 to 2015, according to the World Health Organization, the global increase was 5.0 years, with an even larger increase of 9.4 years in parts of Africa.3

5.  Global trade has expanded as a proportion of GDP from 20% in 1995 to 30% by 2014, signaling greater global integration.4

6.  Access to financial services has greatly expanded in developing countries. According to the World Bank, among adults in the poorest 40% of households within developing economies, the share without a bank account fell by 17 percentage points on average between 2011 and 2014.5

7.  The world’s biggest economy, the U.S., has been recovering. Unemployment has halved in six years from nearly 10% to 5%.6

8.  The world is exploring new sources of renewable energy. According to the International Energy Agency, in 2014, renewable energy such as wind and solar expanded at its fastest rate to date and accounted for more than 45% of net additions to world capacity in the power sector.7

9.  We live in an era of innovation. One report estimates the digital economy now accounts for 22.5% of global economic output.8

10.  The growing speed and scale of data is increasing global connectedness. According to a report by McKinsey & Company, cross-border bandwidth has grown by a factor of 45 in the past decade, boosting productivity and GDP.9

No doubt, many of these advances will lead to new business and investment opportunities. Of course, not all will succeed. But the important point is that science and innovation are evolving in ways that may help mankind.

The world is far from perfect. The human race faces challenges. But just as it is important to be realistic and aware of the downside of our condition, we must also recognize the major advances that we are making.

Just as there is reason for caution, there is always room for hope. And keeping those good things in mind can help when you feel overwhelmed by all the bad news.10

[1] As measured by the MSCI All Country World Index (gross dividends) in USD.

[2] “Human Development Report 2015: Work for Human Development," United Nations. 

[3] “World Health Statistics 2016,” World Health Organization. 

[4] “International Trade Statistics 2015,” World Trade Organization. 

[5] “The Global Findex Database 2014: Measuring Financial Inclusion Around the World,” World Bank.

[6] U.S. Bureau of Labor Statistics, 15 March 2016. 

[7] “Renewable Energy Market Report 2015,” International Energy Agency. 

[8] “Digital Disruption: The Growth Multiplier,” Accenture and Oxford Economics, February 2016. 

[9] “Digital Globalization: The New Era of Global Flows,” McKinsey and Company, March 2016.

[10] Adapted from “10 Reasons to be Cheerful,” Jim Parker, Outside the Flags, DFA, June 2016.

GDP Growth and Equity Returns

Many investors look to gross domestic product (GDP) as an indicator of future equity returns.

According to the advance GDP estimate released by the Bureau of Economic Analysis (BEA) on April 28, annualized real U.S. GDP growth was 0.5% in the first quarter of 2016—below the historical average of 3.2%.11 This might prompt some investors to ask whether below-average quarterly GDP growth has implications for their portfolios.

Market participants continually update their expectations about the future, including expectations about the future state of the economy. The current prices of the stocks and bonds held by investors therefore contain up-to-date information about expected GDP growth and a multitude of other considerations that inform aggregate market expectations. Accordingly, only new information that is not already incorporated in market prices should impact stock and bond returns.

Quarterly GDP estimates are released with a one-month lag and are frequently revised at a later point in time. Initial quarterly GDP estimates were revised for 54 of the 56 quarters from 2002 to 2015.12 Thus, the final estimate for last quarter may end up being higher or lower than 0.5%.

Prices already reflect expected GDP growth prior to the official release of quarterly GDP estimates. The unexpected component (positive or negative) of a GDP growth estimate is quickly incorporated into prices when a new estimate is released. A relevant question for investors is whether a period of low quarterly GDP growth has information about short-term stock returns going forward.13

From 1948 to 2016, the average quarterly return for the S&P 500 Index was 3%. When quarterly GDP growth was in the lowest quartile of historical observations, the average S&P 500 return in the subsequent quarter was 3.2%, which is similar to the historical average for all quarters. This data suggests there is little evidence that low quarterly GDP growth is associated with short-term stock returns above or below returns in other periods (Sources: S&P Dow Jones Indices, Bureau of Economic Analysis).

UK’s EU Referendum Result

On June 23, citizens of the United Kingdom voted to leave the European Union. While there has been much speculation leading up to and since the vote, many of the longer-term implications of the referendum remain unclear, as the process for negotiating what a UK exit may look like are just beginning.

TAGStone Capital, and our strategic alliances, have years of experience managing portfolios, including during periods of uncertainty and heightened volatility. We monitor market events—including their impact on investment managers, whose funds we use in client portfolios—very closely and consider the implications of new information as it comes to light. We are paying close attention to market mechanisms and they appear to be functioning well. Our investment philosophy and process have withstood many trying times and we remain committed.

We urge caution in allowing market movements to impact long-term asset allocation. Long-term investors recognize that risks and uncertainty are ever present in markets. A drop in prices is generally due to lower expectations of cash flows, higher discount rates, or both. In some cases, a drop is also due to investors demanding liquidity.

In the current situation, some investors and economists may expect lower cash flows due to possible barriers that may or may not be implemented. Higher discount rates may be occurring due to uncertainty about changes in the economic landscapes and regulations.

We have seen markets increase discount rates in times of uncertainty before, resulting in lower prices and increased expected returns. However, it is difficult to know when good outcomes will materialize in the future. By attempting to time the right moment to invest or redeem, one risks not enjoying the potential benefit of such materializations.

Many of those who exit the markets miss the recoveries. What we have often seen in the past is that investors who remained in well-diversified portfolios were rewarded over time.

Leading up to and since the vote, we have worked with our counterparties, including investment managers, portfolio managers, and custodians, regarding potential operational implications resulting from the UK’s leaving the EU. The UK will have up to two years to negotiate a withdrawal, during which time it remains subject to EU treaties and laws. Any potential operational changes depend on what path the UK and EU decide to take.

TAGStone remains committed to helping its clients have a good investment experience.

[11] Source: Bureau of Economic Analysis

[12] 2002 to 2015 is the longest time period for which BEA provides data comparing initial to final estimates. The average difference between an initial and final estimate was 1% in absolute magnitude over this time period.

[13] Adapted from “GDP Growth and Equity Returns,” Issue Brief, DFA, May 2016.


Past performance does not guarantee future results. All investments include risk and have the potential for loss as well as gain.

Data sources for returns and standard statistical data are provided by the sources referenced and are based on data obtained from recognized statistical services or other sources we believe to be reliable. However, some or all information has not been verified prior to the analysis, and we do not make any representations as to its accuracy or completeness. Any analysis nonfactual in nature constitutes only current opinions, which are subject to change. Benchmarks or indices are included for information  purposes  only  to  reflect  the  current  market  environment;  no  index  is  a directly  tradable  investment.  There  may  be  instances  when  consultant  opinions  regarding any fundamental or quantitative analysis do not agree.

The  commentary  contained  herein  has  been  compiled  by  W.  Reid  Culp,  III  from  sources  provided  by  TAGStone  Capital,  Capital  Directions,  DFA,  Vanguard,  Morningstar,  as  well  as  commentary  provided  by  Mr.  Culp,  personally,  and  information  independently  obtained  by  Mr.  Culp.  The  pronoun  “we,”  as  used  herein,  references collectively the sources noted above.

TAGStone Capital, Inc. provides this update to convey general information about market conditions and not for the purpose of providing investment advice. Investment in any of the companies or sectors mentioned herein may not be appropriate for you. You should consult your advisor from TAGStone for investment advice regarding your own situation.


Climbing a Wall of Worry

First Quarter 2016 proved to be a volatile one for investors. Before suddenly rallying in mid-February, stocks got off to their worst start ever to begin the New Year. From peak to trough (high to low), large U.S. stocks, as measured by the S&P 500 index, fell more than 10% from January 1 to February 11.

This size decline was not unusual for stocks, as the average intra-year decline for the S&P 500 dating back to 1980 is 14.2%. But, what was extraordinary was the timing of the decline.

After a Fourth Quarter 2015 rally, which saw stocks regain their highs after August 2015 lows, investors were shocked to see stocks take a similar decline to begin the year. Speaking with clients, friends, and family, we found a profound sense of pessimism permeating our conversations.

While this pessimism can mute a stock market rally, it is the same force that keeps stock prices in check and provides the higher returns afforded to stocks. Without a sense of pessimism, stock markets can separate from reality, and asset prices can become overpriced.

This is what occurred with technology stocks in the dot-com bubble and home prices in the housing bubble. In periods of irrational exuberance, price action takes over, and people forget that asset prices can go down.

This leads us back to the old Wall Street adage about the market’s ability to “climb a wall of worry.” This saying points to financial markets’ periodic tendency to overcome a host of negative factors and keep rising.

In the last twenty-years (1995-2015), we have experienced the Asian currency crisis (1997), dot-com collapse (2000), 9/11 (2001), subprime mortgage crisis (2007-2008), and the U.S. debt downgrade (2011) to name a few.

Each of these economic, political, or geopolitical issues were significant enough to affect consumer and investor sentiment, which in turn affected stock markets. However, each of these events proved to be a temporary stumbling block, rather than a permanent impediment to stock market advances.

Who Gets What - and Why

There are numerous reasons why stock markets climb a wall of worry—from investor confidence that short-term issues will be resolved to the sheer force of financial markets.

So, what is it that makes financial markets so powerful? To answer this question, it is helpful to look at markets, in general.

Markets are ancient human inventions, which people developed as tools to organize themselves, to cooperate, coordinate, and compete with one another, and ultimately to figure out who gets what.

Markets are all about matchmaking. Markets bring together buyers and sellers, students and teachers, job seekers and those looking to hire, and even sometimes those looking for love.

In his book, “Who Gets What – and Why,” Nobel-Prize-Winning economist, Alvin E. Roth, says markets are human artifacts that “play a role in all things we do and in everything we make (we can’t even make love, let alone war, without them).”

We experience markets through marketplaces, and a stock market is only one type of market we encounter in our daily lives. Other markets include Amazon.com on our smartphones, job and dating markets, and specialized markets like kidney exchanges.

Each of these markets is an advanced form of the first markets used by humans more than 10,000 years ago. In fact, the design and use of markets is older than agriculture, but even after thousands of years, markets are not widely or deeply understood.

This lack of understanding easily leads to the fear and anxiety we experience from investing in stocks. Many people believe investing in stocks is a rigged casino game. And, this is exactly the message that Michael Lewis, the famed author of “The Big Short,” recently espoused while promoting his new book.

Fortunately, this is not the case. In its simplest terms, a stock market is a marketplace where companies go to attract investment capital, and investors go to choose in which companies to invest their savings and investment capital.

Through decades of development and refinement, our capital markets, while not perfect, are as efficient and effective at determining the fair prices of securities as they have ever been.

One of the most significant events of the last fifty years was the fall of communism, which unleashed the power of markets to millions of new consumers and raised their standard of living. The power of markets is still as effective today as it was back then (probably even more so now).

Today, the unrelenting pace of innovation produces better technologies, higher-quality goods, and more effective services. Billions of savvy consumers with money in their pockets are ready to utilize markets to buy these technologies, goods, and services.

When innovation and the market system interact, it produces productivity gains that deliver tremendous benefits to our society. This is one reason our citizens, as a whole have enjoyed and will continue to enjoy major gains in the goods and services they receive.

This point is reiterated by Warren Buffett in his recent annual letter to shareholders, released in February 2016, where he states:

“Nothing rivals the market system in producing what people want – nor, even more so, in delivering what people don’t yet know they want. My parents, when young, could not envision a television set, nor did I, in my 50s, think I needed a personal computer. Both products, once people saw what they could do, quickly revolutionized their lives. I now spend ten hours a week playing bridge online. And, as I write this letter, “search” is invaluable to me. (I’m not ready for Tinder, however.)

“For 240 years it’s been a terrible mistake to bet against America, and now is no time to start. America’s golden goose of commerce and innovation will continue to lay more and larger eggs. America’s social security promises will be honored and perhaps made more generous. And, yes, America’s kids will live far better than their parents did.

Who Gets What - and Why (continued)

“Moreover, investors who diversify widely and simply sit tight with their holdings are certain to prosper: In America, gains from winning investments have always far more than offset the losses from clunkers. (During the 20th Century, the Dow Jones Industrial Average – an index fund of sorts – soared from 66 to 11,497, with its component companies all the while paying ever-increasing dividends.)”

We side with Warren on this one.

A Successful Investment Experience

“As an investor, what do you regard as the most difficult period in the financial markets during the last 45 years?”

Many older clients regard the 1973–1974 bear market as the toughest period in their investment lifetime. Middle-aged investors may consider the tech boom and bust of the late 1990s and early 2000s to be the bellwether event for a generation of investors who assumed they could get rich on one great stock pick. Today, just about everyone remembers the 2008–2009 global financial crisis, having experienced the anxiety of declining investment accounts themselves or knowing someone who did.

The market decline in early 2016 had much of the same feel as past events. Times like these are never easy for investors, who must confront their concern that “things just might be different this time.” When in the midst of a market decline, it is natural to sense that the volatility is lasting longer and is worse than anything before.

Even though, intellectually, we may understand the power of markets and that stocks climb a wall of worry, emotionally, how do we minimize the fear and anxiety we feel about our investment portfolios and retirement security?

As we know, no single word or story can ease our concerns—and certainly not overnight. But, the more effective course may be to steadily head down a path from worry to calm through conversations about the process of sticking to our investment plans.

This is the same approach world-class athletes use in high-pressure situations. Numerous books and articles describe how the greatest athletes, from Olympians to all-star professionals, focus on process rather than outcome when competing at the highest level.

The prepared athlete does not hope for an outcome or get nervous or scared as the moment approaches. He or she immediately falls back on the tried and tested routine performed countless times in a more serene environment (practice). Following the routine dulls the noise of the crowd and brings clarity of mind.

The same lessons apply to the seasoned investor. A chaotic market is akin to what the visiting team experiences in a gym, where opposing fans and players are doing everything possible to distract you. You stay focused on a routine burned into your nature through coaching and repetitive practice.

The components of the seasoned investor’s routine are similar: the investment policy statement, the regular review of family goals and liquidity needs, and the regular calls an advisor makes during good and bad markets. These and other actions are all part of the process developed to summon that muscle memory needed in stressful times. Just as the great athlete navigates through the moments of pressure in any athletic event, the actions are part of the routine that allows the individual to navigate through a chaotic market like we have today.

Sticking to the Plan

Statistics and data are the bedrock for the insights we gain about the capital markets, but it is often the conversational story that can help us focus on the simplest and most important tenets of investment success.

As always, the financial news media and the Wall Street selling-machine are in full swing and as effective as ever. These forces can make investors lose track of what is important, focus on short-term conditions, and make constant adjustments to their investments.

Instead of responding fearfully to the financial news media and chasing the promises of market-beating returns coming out of Wall Street, we at TAGStone Capital have the responsibility to select the investments that allow our clients to best reach their investment goals and objectives without taking outsized risks.

In addition, investment management is only one part of our clients’ overall wealth management plans—equally important are tax planning, estate planning, and asset protection. It is our job to understand these broad needs to build and adjust investment strategies that are integral to our clients’ overall plans.

This is why we believe in following an investment strategy that is process-based and can be followed regardless of the market or time period. Just like the world-class athlete in a high-pressure situation, we encourage you to maintain the discipline needed to follow a process, which can lead to a great investment experience.


Past performance does not guarantee future results. All investments include risk and have the potential for loss as well as gain.

Data sources for returns and standard statistical data are provided by the sources referenced and are based on data obtained from recognized statistical services or other sources we believe to be reliable. However, some or all information has not been verified prior to the analysis, and we do not make any representations as to its accuracy or completeness. Any analysis nonfactual in nature constitutes only current opinions, which are subject to change. Benchmarks or indices are included for information  purposes  only  to  reflect  the  current  market  environment;  no  index  is  a directly  tradable  investment.  There  may  be  instances  when  consultant  opinions  regarding any fundamental or quantitative analysis do not agree.

The  commentary  contained  herein  has  been  compiled  by  W.  Reid  Culp,  III  from  sources  provided  by  TAGStone  Capital,  Capital  Directions,  DFA,  Vanguard,  Morningstar,  as  well  as  commentary  provided  by  Mr.  Culp,  personally,  and  information  independently  obtained  by  Mr.  Culp.  The  pronoun  “we,”  as  used  herein,  references collectively the sources noted above.

TAGStone Capital, Inc. provides this update to convey general information about market conditions and not for the purpose of providing investment advice. Investment in any of the companies or sectors mentioned herein may not be appropriate for you. You should consult your advisor from TAGStone for investment advice regarding your own situation.


Markets Have Rewarded Discipline

A disciplined investor looks beyond the concerns of today to the long-term growth potential of markets. The chart below shows how $1 invested in 1926 in various asset classes has grown through 2014. The top line shows that $1 invested in small cap U.S. stocks in 1926 would have grown to $18,176 by 2014, which is a full $12,863 more than $1 invested in large cap U.S. stocks over that same period.

While these lines look relatively straight with only small flickers, we must remember that each small waver can feel like an all or nothing proposition when living through it. The chart below illustrates this point by showing the financial news headlines that have accompanied major market movements of the last 45 years.

While some of the movements may look minor from afar, if you take a closer look you can see how large they actually were in the moment. For example, the S&P 500 Index was down 43% in 1974 and the Dow Jones Industrial Average dropped 23% in one day in 1987. However, the market recovered from these temporary declines and climbed ever higher.

More recently, headlines related to the current market pullback have focused on oil prices and China’s growth. Both of these areas are in transition, and the broader stock markets are reacting to the uncertainty surrounding them. This is not unlike other recent pullbacks when the market was trying to sort out the U.S. fiscal cliff worries and the European sovereign debt crisis. Our opinion is that this too shall pass and the market will regain its footing and climb higher over the long term.

Avoiding Trains

It seems as though the market may continue to be bumpy, but we think your portfolios are well positioned to weather the storm. Many times, there is a tendency to believe that stock investing is similar to walking along a train track. For example, if we are walking along a set of train tracks and see a train coming, it’s easy to get off the tracks, let the train pass, and then get back on the tracks again. However, with stock investing we think this is hard to do, and we have seen firsthand with clients how difficult it can be.

The difficulty is related to timing the market, which requires making two correct decisions:

1) When to get out of the market, and

2) When to get back into the market.

Avoiding Trains (continued)

With so much noise in the news and financial press, it’s hard to find a clear “sell” and “buy” signal for the top and bottom of the market. Moreover, research shows that even professional money managers are not good at making these calls.

The reason for this is that humans are not wired for disciplined investing. The research shows that people tend to apply faulty reasoning to investing, when they follow their natural instincts. This is why we follow a structured investment strategy at TAGStone Capital based on years of academic research.

What we do know is that:

1.  Markets have historically shown to go higher over time,

2.  Certain groups of stocks have shown to outperform others over the long term, but this does not always hold over the short term and it is difficult to pick which groups of stocks will outperform during those shorter periods, and

3.  Having an appropriate balance between stocks and bonds provides the means for an investor to stick to an investment strategy, because all investment strategies have periods of relative underperformance.

The last point is reiterated by David Booth, CEO of Dimensional Fund Advisors, in the Barron’s article we have shown many of you before. In the last paragraph of the article, Booth says, “Where people get killed is getting in and out of investments. They get halfway into something, lose confidence, and then try something else. It’s important to have a philosophy.”

This Too Shall Pass

Although there is substantial weakness in several parts of the market, including energy, commodities, and heavy industry, we believe that the six-plus year expansion led by consumers is still in place.

The large-scale sell off we have seen in energy stocks over the last six months is partly due to high valuations as a result of low energy prices. The general market, on the other hand, as measured by the S&P 500, has recently been trading below its twenty-year forward P/E ratio, and valuations get better as markets decline.

Determining what exactly will happen over the short term is a difficult game. Since volatility tends to arrive in clusters, the market may have more negative volatility ahead as over valuations in certain parts of the market are corrected.

We are optimistic that this too shall pass as the U.S. economy continues its long-term expansion. While we are optimistic, we do recommend that investors periodically review their basic ratio between stocks and bonds to be comfortable that their ratio is consistent with their current risk profile. At the same time, investors should be fully prepared to take advantage of long-term opportunities that may present themselves to rebalance into over-sold asset classes according to their investment strategies.


Past performance does not guarantee future results. All investments include risk and have the potential for loss as well as gain.

Data sources for returns and standard statistical data are provided by the sources referenced and are based on data obtained from recognized statistical services or other sources we believe to be reliable. However, some or all information has not been verified prior to the analysis, and we do not make any representations as to its accuracy or completeness. Any analysis nonfactual in nature constitutes only current opinions, which are subject to change. Benchmarks or indices are included for information  purposes  only  to  reflect  the  current  market  environment;  no  index  is  a directly  tradable  investment.  There  may  be  instances  when  consultant  opinions  regarding any fundamental or quantitative analysis do not agree.

The  commentary  contained  herein  has  been  compiled  by  W.  Reid  Culp,  III  from  sources  provided  by  TAGStone  Capital,  Capital  Directions,  DFA,  Vanguard,  Morningstar,  as  well  as  commentary  provided  by  Mr.  Culp,  personally,  and  information  independently  obtained  by  Mr.  Culp.  The  pronoun  “we,”  as  used  herein,  references collectively the sources noted above.

TAGStone Capital, Inc. provides this update to convey general information about market conditions and not for the purpose of providing investment advice. Investment in any of the companies or sectors mentioned herein may not be appropriate for you. You should consult your advisor from TAGStone for investment advice regarding your own situation.


”It’s always something. And then it’s nothing.”

Stocks saw their first true panic selling in Third Quarter 2015 since the U.S. default crisis of 2011. In a particularly volatile week in mid-August, the Dow fell nearly 2,000 points in just five trading sessions. The VIX index, which measures the level of fear in the stock market, spiked into the mid-50 range, a level last seen during the 2008-09 financial crisis. For perspective, a reading of 30 in the VIX index is considered “extreme fear.”

Investors responded predictably to these events: They ran screaming for the exits like their hair was on fire. Net equity mutual fund redemptions for the week of August 25 totaled $29 billion – a new record. Net equity fund outflows the day the selling peaked were at a level not seen since October 2008.

Lost in all this hysteria was the reality that a downturn of this magnitude was hardly out of the ordinary. The average peak-to-trough (high point to low point) decline for the market on a yearly basis going back to 1980 is 14.1%. By that measure this decline was little more than business as usual. Yet another $29 billion now sits parked on the sidelines in cash, having missed the upturn that began in September and has continued to the date of this writing.

Where the stock market heads from here is, of course, anyone’s guess. But even if the coming months see another, even deeper, downturn, we know that whatever events are the cause of it – a slowing Chinese economy, rising interest rates, etc. – will eventually run their course. As financial writer Nick Murray is fond of saying, “it’s always something. And then it’s nothing.” Meaning that events resolve themselves over time and then the stock market commences its inexorable upward climb.

Sometimes those events come and go quickly, like the 2011 bear market following the U.S. default crisis. And sometimes those events are long and worrisome, like the 2008-09 financial crisis. Whatever their nature, though, the goal for long-term investors is the same: to be able to endure those events and come out on the other side with your portfolio intact so that you are there when the inevitable recovery commences, as it always does.

That’s why spreading risk among asset classes and investment styles is so important. Many investors who were concentrated in financial stocks were wiped out when The Great Recession hit and had no assets left to invest when the ensuing recovery began in 2009. In contrast, well-diversified investors recovered relatively quickly – as long as they stayed put.

The long recovery that commenced in 2009 was not unusual; in fact, it was typical of market recoveries after major downturns. Consider the chart on the previous page showing the one-, three-, and five-year returns for a hypothetical 60% stock / 40% bond portfolio following some of the major crises of the past thirty years.

Staying put is, of course, the hard part, as evidenced by the billions of dollars that fled the market a few weeks ago. It’s especially hard when the media gloom machine is in full force as it is right now. CNN breathlessly reported on August 26 that “$2.1 trillion was erased from the U.S. stock market in six days.” Who wouldn’t find that alarming? And yet can you recall any article since then pointing out that the market has since added back about $1 trillion? Or pointing out the fact that U.S. household net worth has increased nearly $17 trillion from the pre-recession levels of 2007? Neither can we.

That’s why it’s imperative to turn off the TV and walk away from the computer when panic hits the markets and a long-term perspective becomes difficult to maintain. Just remember this mantra: It’s always something. And then it’s nothing.

Focus on Things You Can Control

When things get dicey in the market and the emotional need to “take action” becomes acute, we always advocate for taking action on the things we can control – as opposed to worrying about the short-term direction of the market, which we can’t control.

In that regard, there are a number of estate planning and asset protection items to remember to help ensure your total financial picture is being addressed, in addition to your investment portfolio. One of the most important areas to consider relates to wealth transfer. Following are a list of items we can help you review and evaluate to be sure your wealth transfer plan is as efficient as possible:

1.  Review your existing estate plan. We find the majority of estate plans are not up to date. Why? Life intrudes; things change – your net worth, the tax laws, your family situation, and so on. Be sure your plan is up to date.

2.  Create comprehensive financial statements. Be sure you have everything in order. This can be one of the greatest gifts you can give your loved ones in the case of your unexpected death.

3.  Define your family goals. What are you looking to achieve? You don’t want your estate planning to be purely tax-motivated; you want it aligned with your values and goals.

4.  Consider alternatives for education funding. If funding education is one of your goals, there is a variety of options available to help fund education for future generations while reducing the tax burden on your estate.

5.  Consider dynasty or generation-skipping trusts. If there is a desire to pass assets inter-generationally, dynasty trusts can be very helpful in accomplishing this.

6.  Evaluate prospects for “opportunity shifting.” Again, there may be opportunities to shift assets and income between different entities or family members that may be very attractive.

7.  Review your life insurance planning. Life insurance can be a very effective tool to help ensure that your estate passes to your heirs tax free.

8.  Structure a favorable entity package. Setting up the appropriate legal entities is crucial to be sure your wealth transfer goals are optimized, whether those are S corps, LLCs, and others.

9.  Determine your charitable goals and gifting alternatives. Your gifting should be structured so that it helps not only your charitable interests but also your estate as well.

10.  Prepare the family business for transfer or sale. If you have a family business, you want to really think through – whether you’re planning on selling it now or not – how you are ultimately going to transfer or sell it. There are a number of vehicles available that can create more favorable valuations for transfers between family members.

If we can help you think through how any of these strategies may help you meet your unique values and goals, please do not hesitate to call us so we can add it to the agenda for your next regular progress meeting.

Perspective in Volatile Times

For the first time since 2011, panic selling hit the stock market in August. Small investors fled for the hills as volatility suddenly spiked in the market, selling $29 billion in equity mutual fund holdings for the week of August 25 – a new record.

As of this writing, stocks have enjoyed a significant rebound, but those investors who bailed out weren’t in the market to see the recovery. We fielded several calls from nervous clients during the height of the downturn and were able to calm their fears. As we have said before, the first responsibility of an investment advisor is to be the emotional barrier between the client and their money. In the grand scheme, this role may be more important than any other.

Volatility remains high in the market and may continue to be so in the near term. We offered some perspective on this subject above and hope you will keep these points in mind if volatility continues in the months ahead.

It is in times of turmoil that we have historically seen the largest influx of assets into our program as clients seek the counsel of the advisors they trust. This is a remarkable response and a tribute to the investment strategy that does not focus on the product-oriented offerings of stockbrokers, insurance agents, banks, etc.


Past performance does not guarantee future results. All investments include risk and have the potential for loss as well as gain.

Data sources for returns and standard statistical data are provided by the sources referenced and are based on data obtained from recognized statistical services or other sources we believe to be reliable. However, some or all information has not been verified prior to the analysis, and we do not make any representations as to its accuracy or completeness. Any analysis nonfactual in nature constitutes only current opinions, which are subject to change. Benchmarks or indices are included for information  purposes  only  to  reflect  the  current  market  environment;  no  index  is  a directly  tradable  investment.  There  may  be  instances  when  consultant  opinions  regarding any fundamental or quantitative analysis do not agree.

The  commentary  contained  herein  has  been  compiled  by  W.  Reid  Culp,  III  from  sources  provided  by  TAGStone  Capital,  Capital  Directions,  DFA,  Vanguard,  Morningstar,  as  well  as  commentary  provided  by  Mr.  Culp,  personally,  and  information  independently  obtained  by  Mr.  Culp.  The  pronoun  “we,”  as  used  herein,  references collectively the sources noted above.

TAGStone Capital, Inc. provides this update to convey general information about market conditions and not for the purpose of providing investment advice. Investment in any of the companies or sectors mentioned herein may not be appropriate for you. You should consult your advisor from TAGStone for investment advice regarding your own situation.


The All-Weather, All-Road Portfolio

Owners of all-purpose motor vehicles often appreciate their cars most when they leave smooth city freeways for rough gravel country roads. In investment, highly diversified portfolios can provide similar reassurance.

In blue skies and open highways, flimsy city sedans might cruise along just as well as sturdier sports utility vehicles. But the real test occurs when the road and weather conditions deteriorate.

That’s why people who travel through different terrains often invest in an SUV that can accommodate a range of environments, but without sacrificing too much in fuel economy, efficiency, and performance.

Structuring an appropriate portfolio involves similar decisions. You need an allocation that can withstand a range of investment climates while being mindful of fees and taxes.

When certain sectors or stocks are performing strongly, it can be tempting to chase returns in one area. But if the underlying conditions deteriorate, you can end up like a motorist with a flat tire on a desert road without a spare.

Likewise, when the market performs badly, the temptation might be to hunker down completely. But if the investment skies brighten and the roads improve, you risk missing out on better returns elsewhere.

One common solution is to shift strategies according to the climate. But this is a tough, and potentially costly, challenge. It is the equivalent of keeping two cars in the garage when you only need one. You’re paying double the insurance, registration, and upkeep costs.

An alternative is to build a single, diversified portfolio. That means spreading risk in a way that helps your portfolio capture what global markets have to offer, while reducing unnecessary risks. In any one period, some parts of the portfolio will do well. Others will do poorly, although you can’t predict which. That is the point of diversification.

It is important to remember that you can never completely remove risk in any investment. Even a well-diversified portfolio is not bulletproof. We saw that in 2008–09, when there were broad losses in markets.

But you can still work to minimize risks you don’t need to take. These include unduly exposing your portfolio to the influences of individual stocks, sectors, or countries—or relying on the luck of the draw.

An example is those people who made big bets on technology stocks in the late 1990s. These concentrated bets might pay off for a little while, but it is hard to build a consistent strategy out of them. And those fads aren’t free. It’s hard to get your timing right, and it can be costly if you’re buying and selling in a hurry.

By contrast, owning a diversified portfolio is like having an all-weather, all-roads, fuel-efficient vehicle in your garage. This way you’re smoothing out some of the bumps in the road and taking out the guesswork.

Because you can never be sure which markets will outperform from year to year, diversification can help increase the consistency of the outcomes and help you capture what the global markets have to offer.

Add discipline and efficient implementation to the mix, and you may get a structured low-cost, tax-efficient solution.

Just as expert engineers can design fuel-efficient vehicles for all conditions, astute financial advisors know how to construct globally diversified portfolios to help you capture what the markets offer in an efficient way, while reducing the influence of random forces.

There will be rough roads ahead, for sure. But with the right investment vehicle, the ride can be a more comfortable one.

The Seven Roles of an Advisor

What is the benefit of a financial advisor? One view is that advisors have unique insights into market direction that give their clients an advantage. But of the many roles a professional advisor should play, soothsayer is not one of them.

The truth is that no one knows what will happen next in investment markets. And if anyone really did have a working crystal ball, it is unlikely they would be plying their trade as an advisor, broker, analyst, or financial journalist.

Some folks may still think an advisor’s role is to deliver market-beating returns year after year. Generally, those are the same people who believe good advice equates to making accurate forecasts.

But in reality, the value a professional advisor brings is not dependent on the state of markets. Indeed, their value can be even more evident when volatility and emotions are running high.

Effective advisors play multiple and nuanced roles with their clients. None of these roles involve making forecasts about markets or economies. Indeed, there are at least seven hats an advisor can wear to help clients without ever once having to look into a crystal ball:

1.  The Expert: Investors need advisors who can provide client-centered expertise in assessing the state of their finances and developing risk-aware strategies to help them meet their goals.

2.  The Independent Voice: The global financial turmoil of recent years demonstrated the value of an independent and objective voice in a world full of product pushers and salespeople.

3.  The Listener: A good advisor will listen to clients’ fears, tease out the issues driving those feelings, and provide practical, long-term answers.

4.  The Teacher: Getting beyond the fear-and-flight phase often is just a matter of teaching investors about risk and return, diversification, the role of asset allocation, and the virtue of discipline.

5.  The Architect: Once these lessons are understood, the advisor becomes an architect, building a long-term wealth management strategy that matches each person’s risk appetites and lifetime goals.

6.  The Coach: Even when the strategy is in place, doubts and fears inevitably arise. At this point, the advisor becomes a coach, reinforcing first principles and keeping the client on track.

7.  The Guardian: Beyond these experiences is a long-term role for the advisor as a kind of lighthouse keeper, scanning the horizon for issues that may affect the client and keeping them informed.

These are just seven valuable roles an advisor can play in understanding and responding to clients’ whole-of-life needs, which are a world away from the old notions of selling product off the shelf or making forecasts. Knowing the advisor is independent—and not plugging product—can lead to better understanding and advice.

However you characterize these various roles, good financial advice ultimately is defined by the patient building of a long-term relationship founded on the values of trust, independence, and knowledge of each individual.

Staying the Course

Though many stock indices still hover near historical highs, volatility now seems to be the order of the day in capital markets. The potential of rising interest rates and Greece's possible exit from the Eurozone economy will no doubt give short-term traders itchy fingers in the months ahead. Long-term investors, however, should have a different perspective. While there will always be periodic events that temporarily roil the markets, long-term stock investing is about participating in the ongoing growth and innovation of companies around the world.

The benefit of that participation has historically been long-term gains in the range of 9% to 10% for stock investors. (Indeed, despite all the shocks to the market in the past two decades, the S&P 500's twenty-year return presently stands at 8.91%.) The trade-off is that stock investors must endure periods of short-term volatility along the way and avoid the temptation to try to time the market. Such futile efforts usually provided all of the volatility and none of the benefit that comes with being a stock investor.


Past performance does not guarantee future results. All investments include risk and have the potential for loss as well as gain.

Data sources for returns and standard statistical data are provided by the sources referenced and are based on data obtained from recognized statistical services or other sources we believe to be reliable. However, some or all information has not been verified prior to the analysis, and we do not make any representations as to its accuracy or completeness. Any analysis nonfactual in nature constitutes only current opinions, which are subject to change. Benchmarks or indices are included for information  purposes  only  to  reflect  the  current  market  environment;  no  index  is  a directly  tradable  investment.  There  may  be  instances  when  consultant  opinions  regarding any fundamental or quantitative analysis do not agree.

The  commentary  contained  herein  has  been  compiled  by  W.  Reid  Culp,  III  from  sources  provided  by  TAGStone  Capital,  Capital  Directions,  DFA,  Vanguard,  Morningstar,  as  well  as  commentary  provided  by  Mr.  Culp,  personally,  and  information  independently  obtained  by  Mr.  Culp.  The  pronoun  “we,”  as  used  herein,  references collectively the sources noted above.

TAGStone Capital, Inc. provides this update to convey general information about market conditions and not for the purpose of providing investment advice. Investment in any of the companies or sectors mentioned herein may not be appropriate for you. You should consult your advisor from TAGStone for investment advice regarding your own situation.